
Russian Rouble (or Ruble) is the currency of the Russian Federation and the 17th most traded currency in the world. Within current environment of rising commodity prices, the world market impact of Russia, which is a major commodities producer, should strengthen. Without any doubt, this fact will increase the trading volumes of the Russian national currency. Therefore, a correct anticipation of the price action of Rouble against the dominating currency USD is essential. The outlook is, hereby, important for USDRUB pair traders as well as for investors in Russian stocks, commodity funds and more. In this blog, a technical analysis of the USDRUB is provided for both long and medium terms.
Rouble Monthly Elliott Wave Analysis 12.06.2020
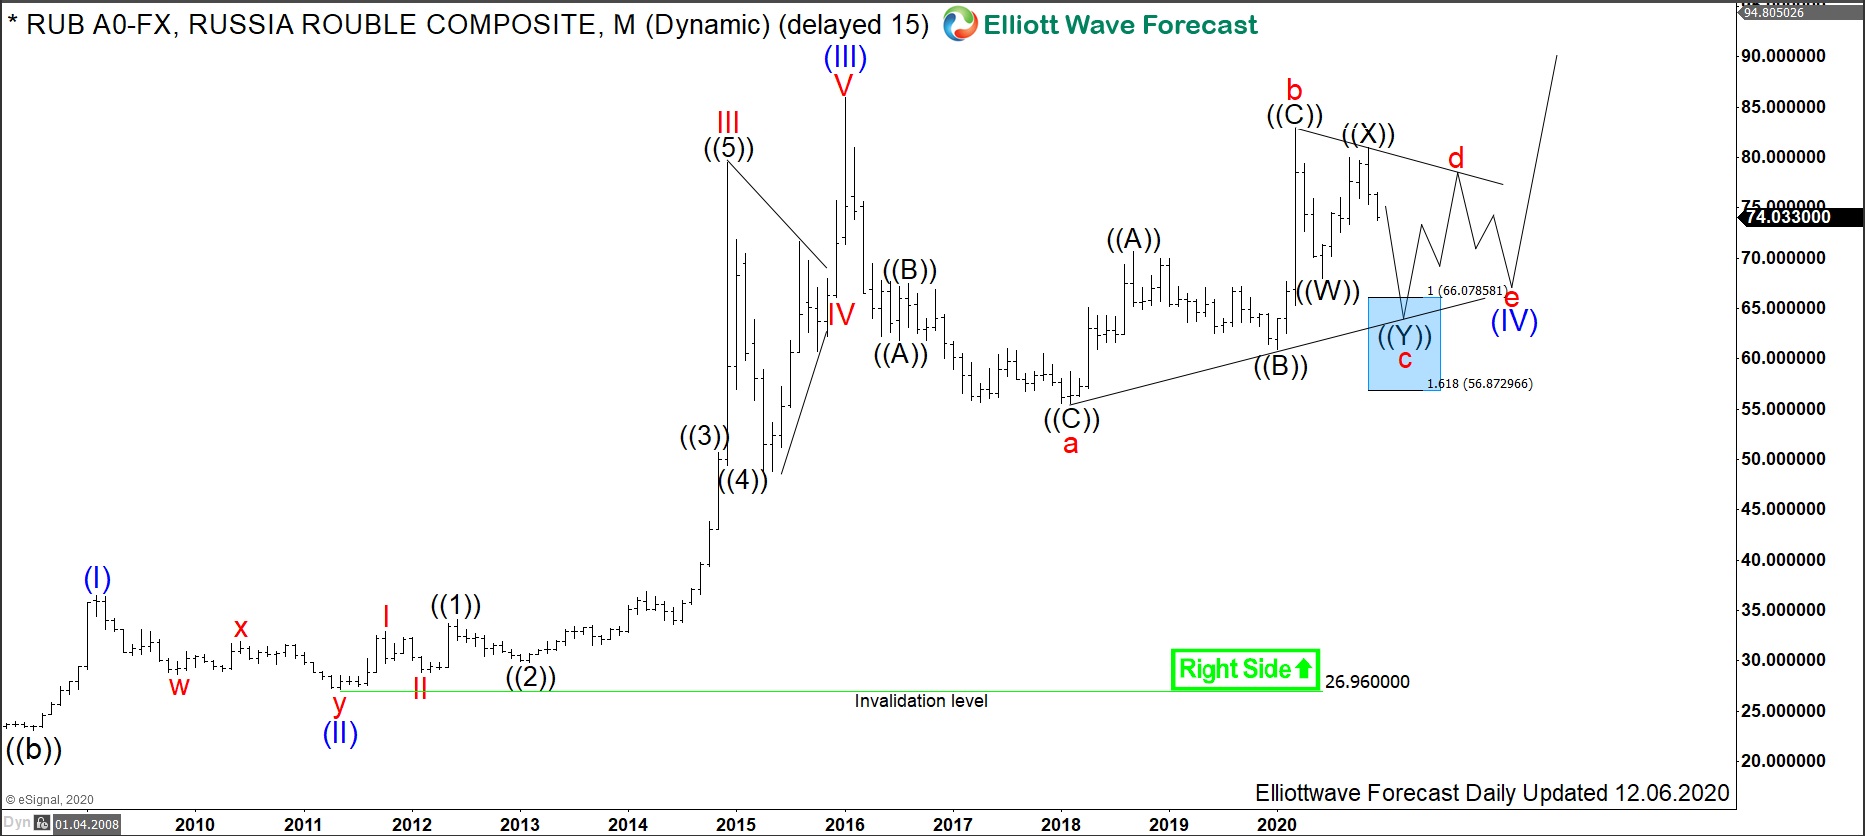
The monthly chart below shows the USDRUB pair traded on the Forex market. From July 2008, the USDRUB is extending higher within a wave ((c)) of a grand super cycle degree. From the 2008 lows at 23.06, the cycle higher has accomplished so far the waves (I)-(III). Hereby, the pair saw the all-time highs on January 2016 at 85.94. Wave (III) has extended far beyond the 1.618 multiples of the wave (I) confirming that the larger cycle from 2008 lows is an impulse. To be mentionned, impulses are motive waves and they count from (I) to (V). Therefore, after a consolidation in wave (IV), at least another push towards 85.94 and higher in wave (V) should be expected. Long term view of USDRUB, as a consequece, favors more Rouble weakness.
In the medium term, Rouble should strengthen against USD. Correlation across the market instruments supports the Elliott Wave contracting triangle pattern in the USDRUB. Triangle is a 3-3-3-3-3 continuation structure. From the January 2016 highs, red waves a and b of the cycle degree have ended on March 2020. While below the 82.90 highs, wave c of (IV) should extend lower towards 66.07-56.87 area. Later on, expect wave d higher to fail below 82.90 highs for another leg lower in wave e. Then, wave (V) can start towards 85.94 highs and even beyond.
Rouble Daily Elliott Wave Analysis 12.06.2020
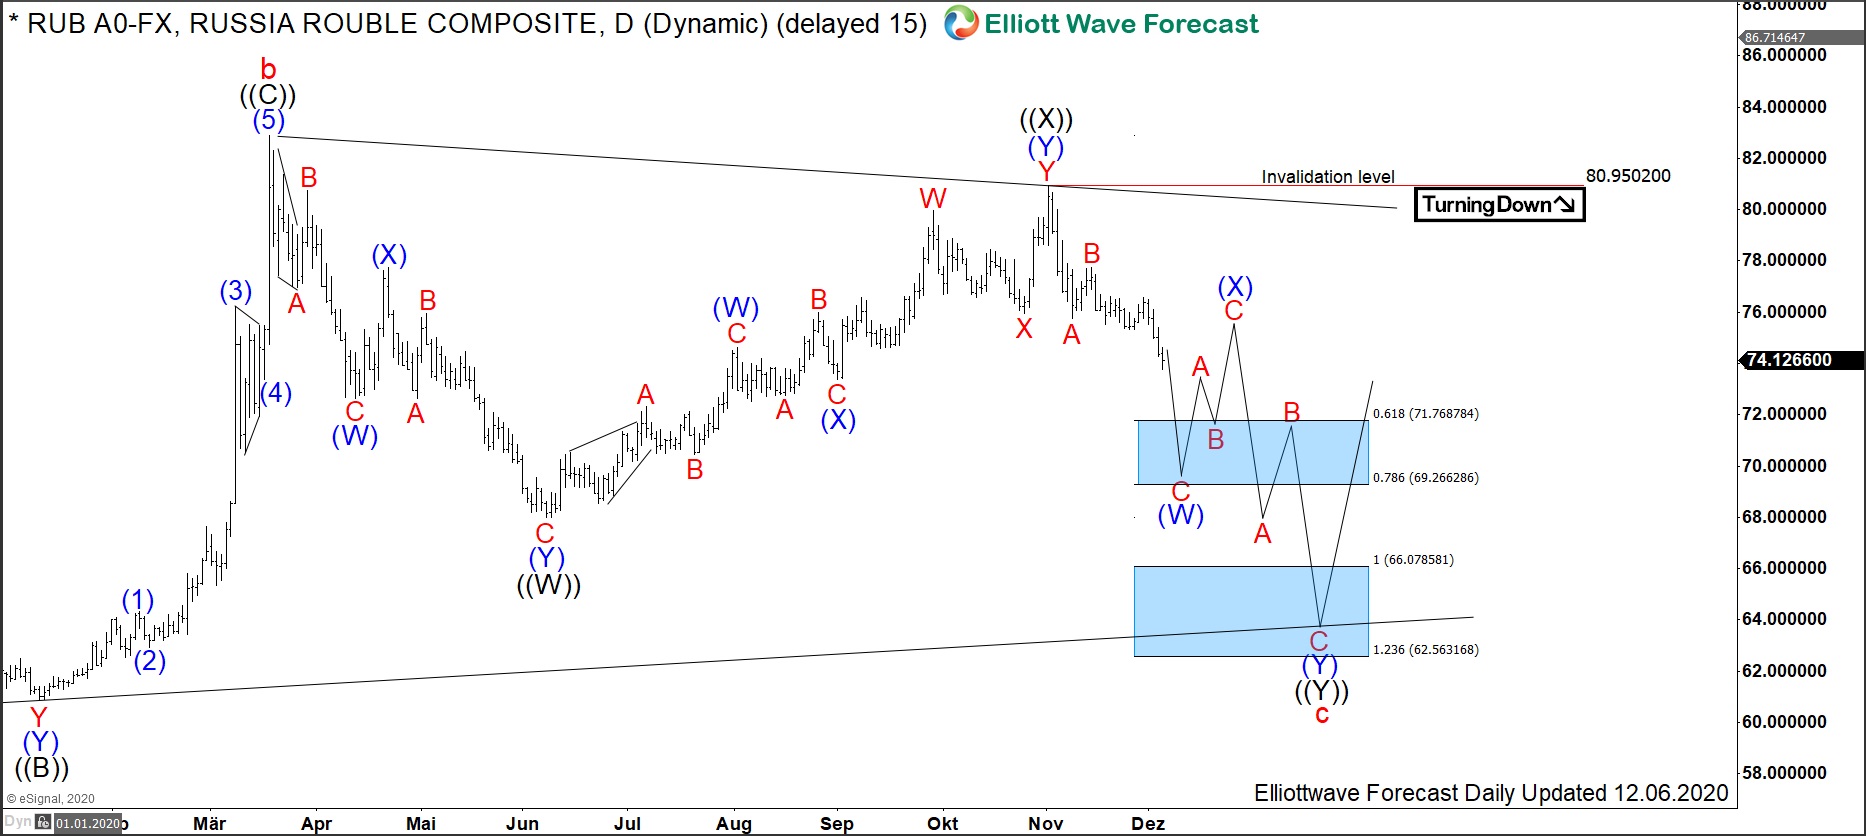
The daily chart below shows the c leg lower of the triangle in wave (IV) in more detail. From the March highs at 82.90 highs, the pair has demonstrated a first leg lower which has accomplished 7 swings corrective structure in wave ((W)). Then, a bounce in wave ((X)) has failed below the march highs. Currently, while below 80.95, another leg down is in progress. It should develop a corrective structure and reach in wave ((Y)) towards 66.07-56.87 area. There, it should find support for a bounce in red wave d higher. Otherwise, in case of breaking below 56.87 level, the triangle pattern in wave (IV) will need a reevaluation.
As an outlook, decline towards 66.07-56.87 area signifies the medium term Rouble strength. However, long term favors still the dominance of the Dollar over the currency of the Russian federation. Indeed, the larger cycle from 2008 looks still incomplete and 85.94 highs should still be reached in a longer run.
Source: https://elliottwave-forecast.com/forex/russian-rouble-shows-strength/