
In this technical blog, we are going to take a look at the past performance of 4 hour Elliott Wave Charts of Dow Futures ticker symbol: $YM_F, which we presented to members. In which, the rally from 23 March 2020 lows, showed the higher high sequence in an impulse structure favored more strength to take place. Also, the right side tag pointed higher & favored more strength. Therefore, we advised our members to buy the dips in Dow Futures in 3, 7, or 11 swings at the blue box areas. We will explain the structure & forecast below:
Dow Futures 4 Hour Elliott Wave Chart
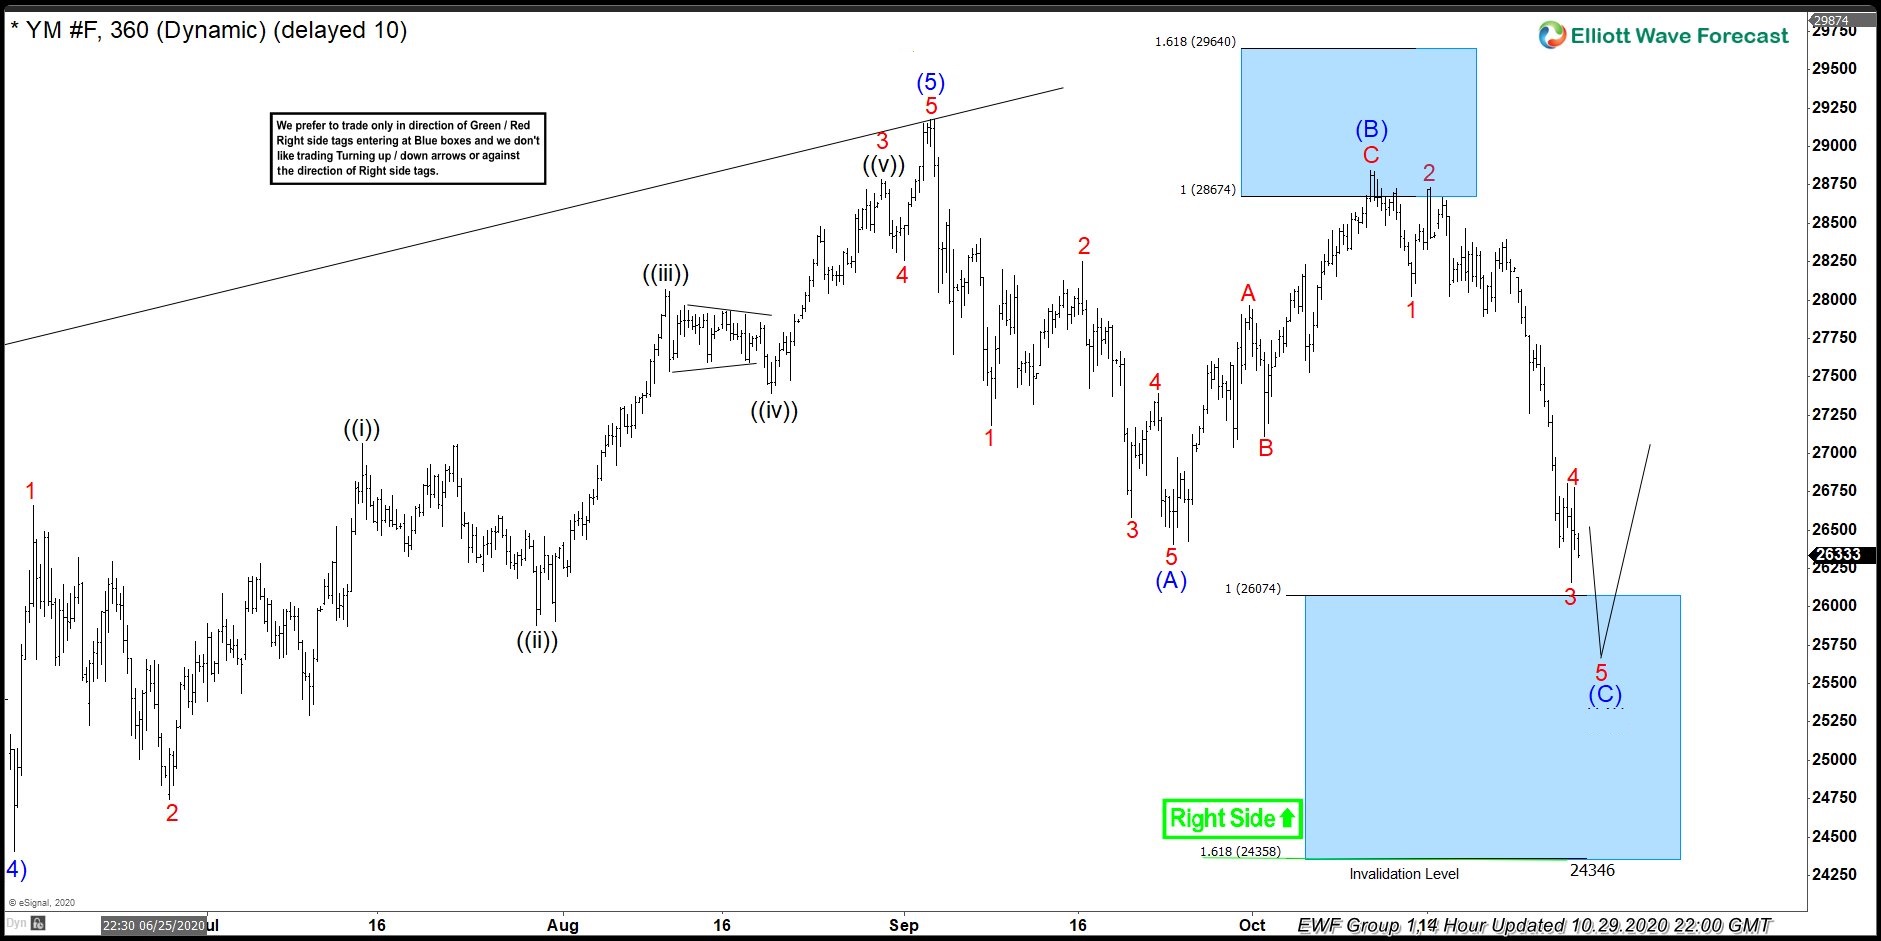
Above is the Dow Futures 4 hour Elliott Wave Chart from the 10/29/2020 update. In which, the rally from 15 June 2020 low unfolded as 5 waves impulse structure. Whereas wave 1 ended at $26658 high, wave 2 ended at $24743 low. Up from there, wave 3 ended at $28783 high. Wave 4 ended at $28257 low, wave 5 ended at $29180 high, and thus completed 5 waves & made a pullback.
Down from there, the index made a pullback lower. The internals of that pullback unfolded as an Elliott wave zigzag structure where wave (A) ended at $26407 low. Wave (B) bounce ended at $28846 high and wave (C) was expected to reach $26074- $24358 100%-161.8% Fibonacci extension area of (A)-(B). Before providing a buying opportunity looking for more upside or for 3 wave reaction higher at least.
Dow Futures 4 Hour Elliott Wave Chart
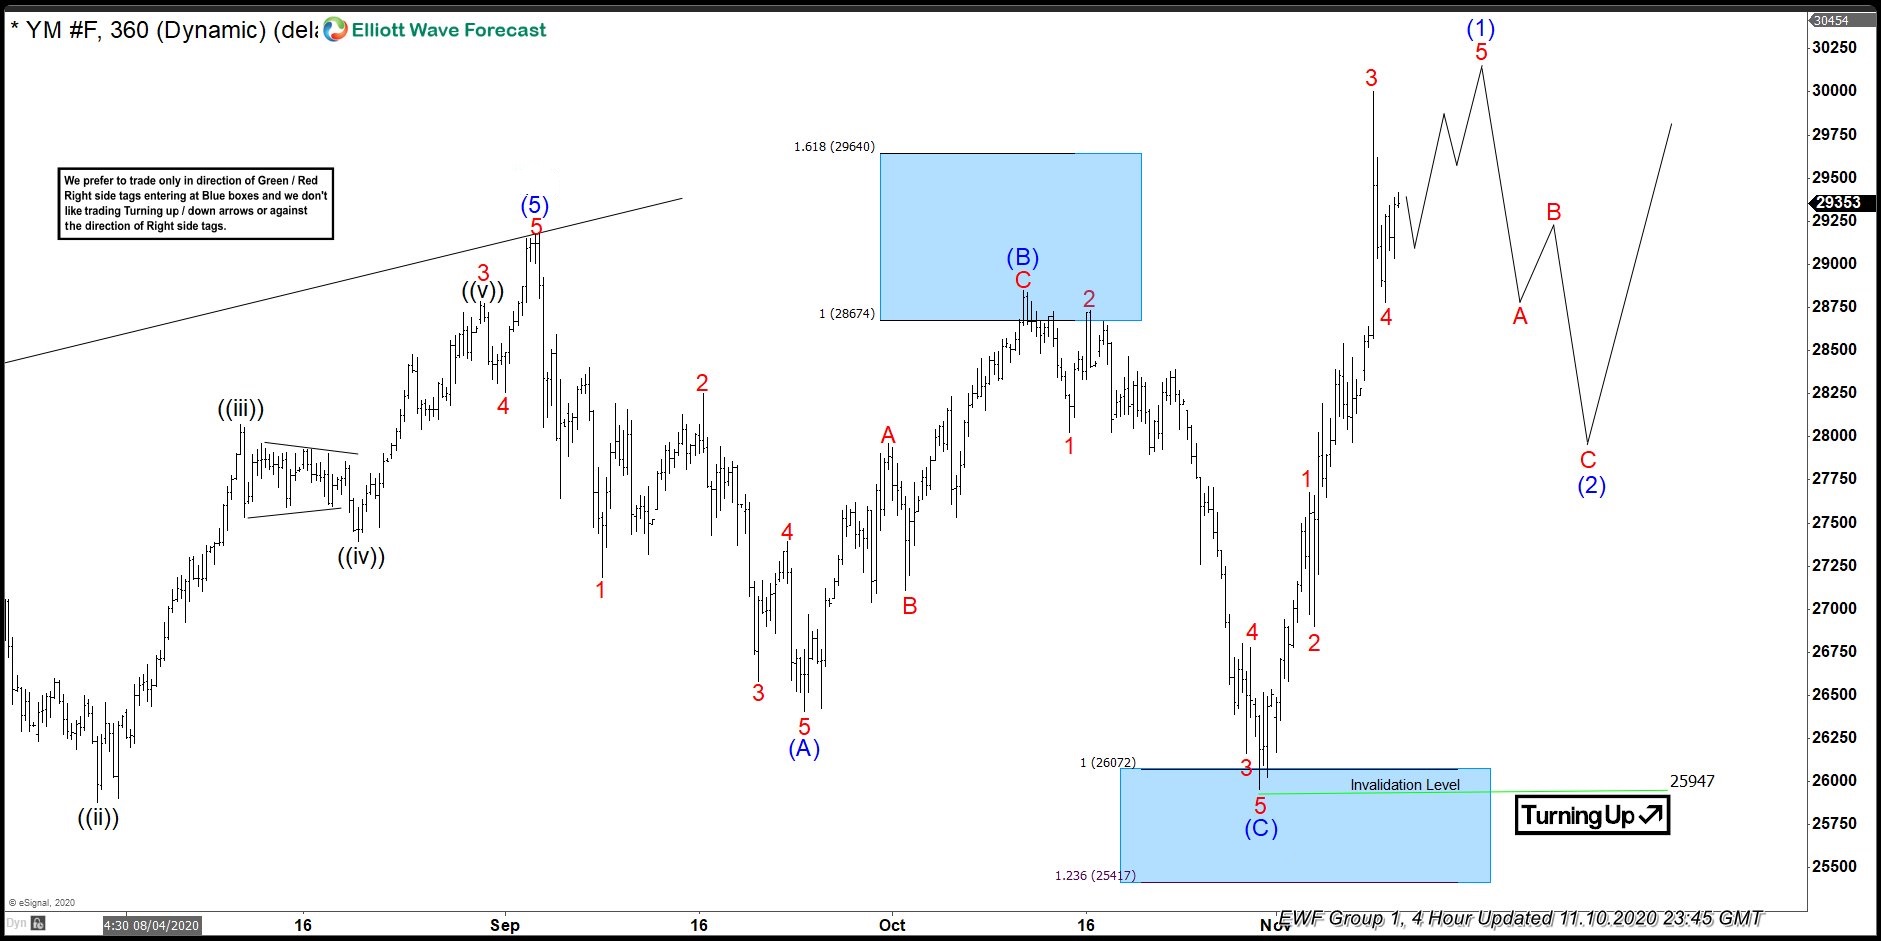
Here’s the latest 4 hour Elliott Wave Chart from 10/27/2020 update, in which the index managed to reach the blue box area at $26074- $24358 & showing a sharp reaction higher taking place from the blue box area. Allowed members to catch the rally shortly after taking the longs at the blue box area.