Soybean Oil is one of the grain & oilseed commodities, along with wheat, soybeans, corn, rice, oats and others. Just behind palm oil, it is the second most used vegetable oil, basically, for frying and baking. Also, soybean oil finds applications medically and, when processed, for printing inks and oil paints. One can trade Soybean Oil futures at Chicago Board of Trade in contracts of 60’000 pounds each under the ticker ZL #F.
Currently, we see commodities like wheat and soybeans turning higher after a long period of depressed prices. Based on the correlation within group of grains & oilseeds, the soybean oil is expected to turn higher as well. In particular, wave structure of ZL #F supports that bullish view. Will the rally in the soybean oil prices make it less affordable for the broad population?
Soybean Oil Weekly Elliott Wave Analysis 11.09.2020
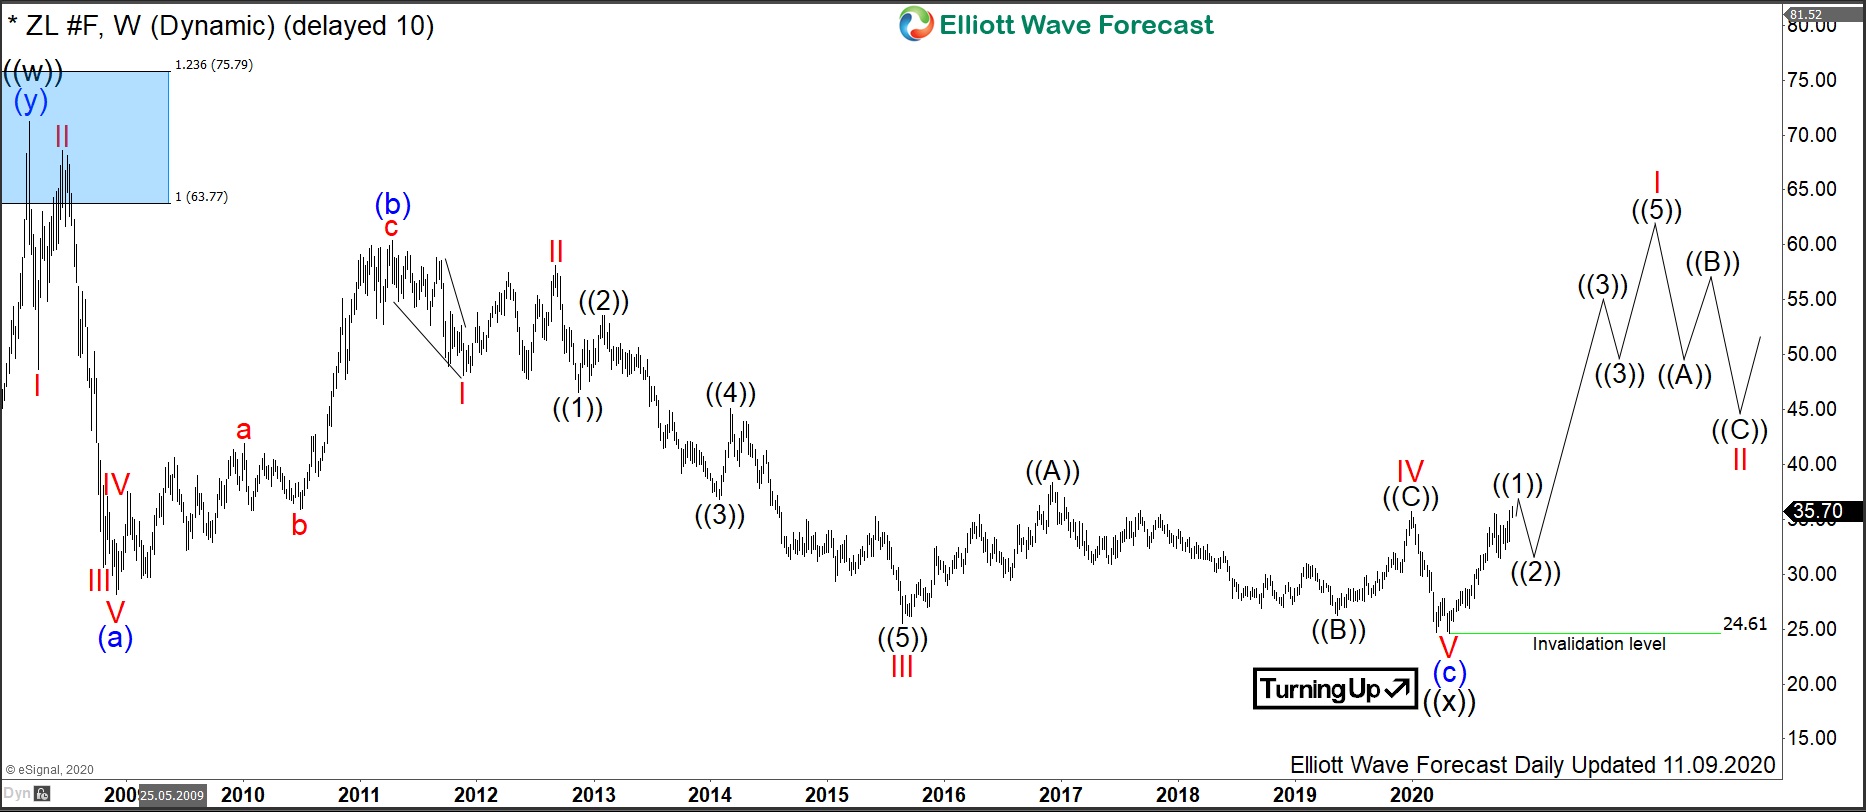
The weekly chart below shows the soybean oil front contract ZL #F. From the all-time lows, the prices have developed a cycle higher in black wave ((w)) of a grand super cycle degree. It has ended in March 2008 at 71.23. From the highs, a correction lower in wave ((x)) has unfolded as an Elliott Wave zigzag pattern. In 12 years, ZL #F has become cheaper by more than 60% reaching 24.61 level. It is the preferred view that an important bottom on April 2020 has been set and the black wave ((x)) has ended. From the lows, the recovery in prices may have started.
For 2020-2030, the expectations are to break out to the new all-time highs. The target for wave ((y)) to end will be 95.88-139.95 area.
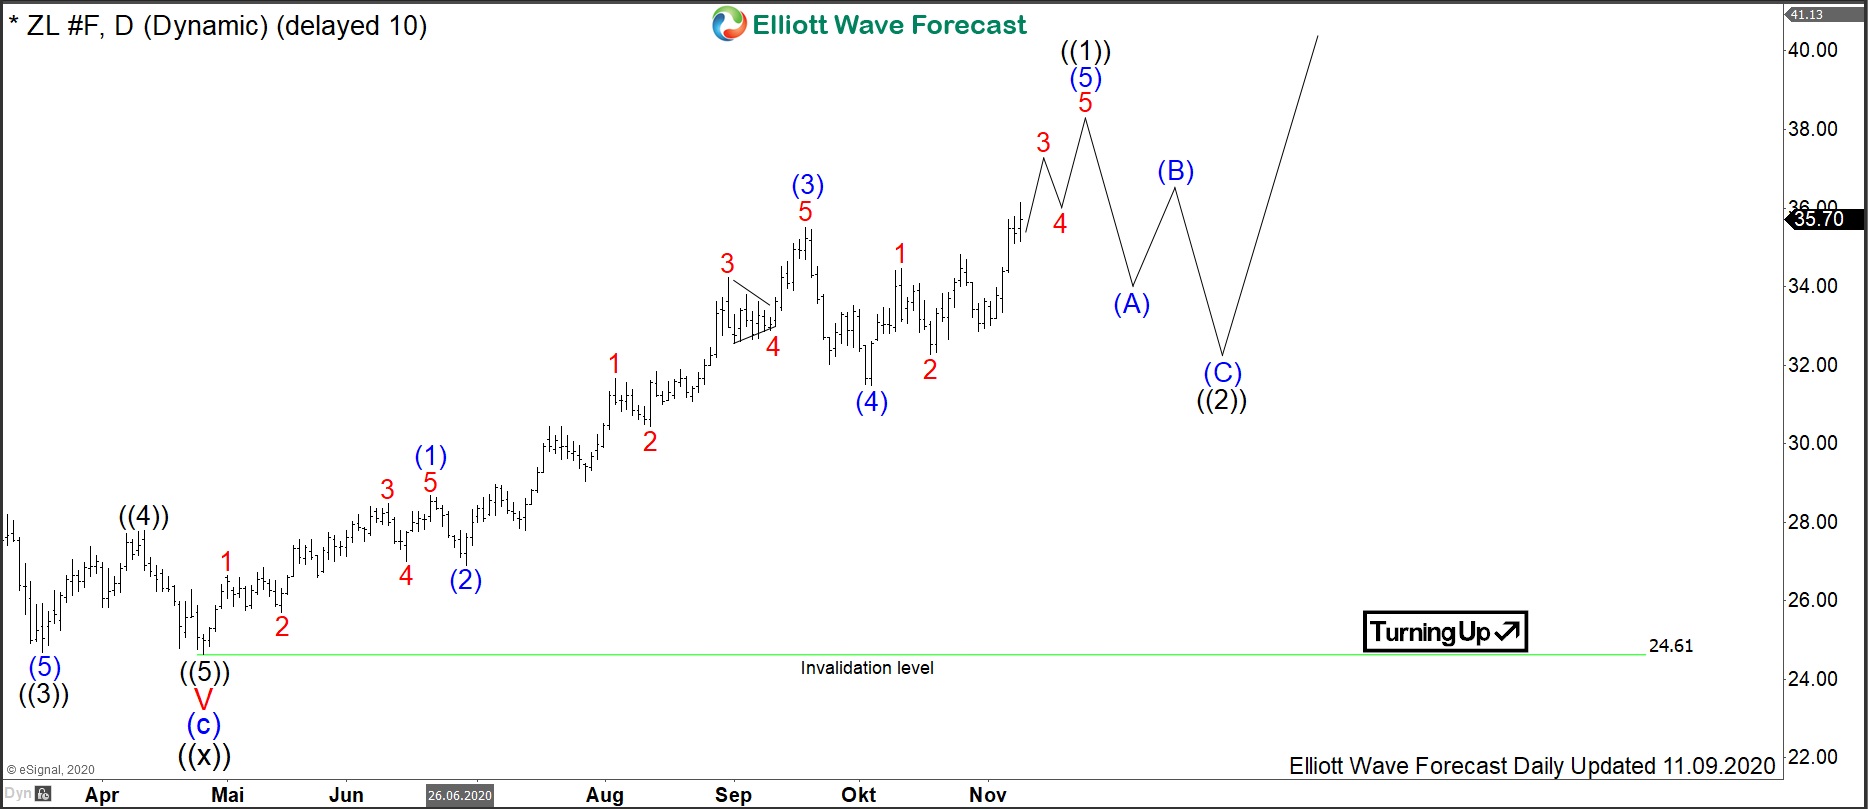
Soybean Oil Daily Elliott Wave Analysis 11.09.2020
The daily chart below shows in more detail the advance from the April 2020 lows. From the bottom at 24.61, black wave ((1)) higher is unfolding as an impulse which is still in progress. Within it, waves (1)-(4) have ended, wave (5) is extending higher and should end soon the entire April cycle higher in wave ((1)). Later on, the pullback in wave ((2)) should find support in 3, 7, 11 swings for an extension higher in wave ((3)).
Investors and traders can be, therefore, looking to buy pullbacks in 3, 7 or 11 swings against 24.61 lows. In a long run, soybean oil should reach 95.88-139.95 area.