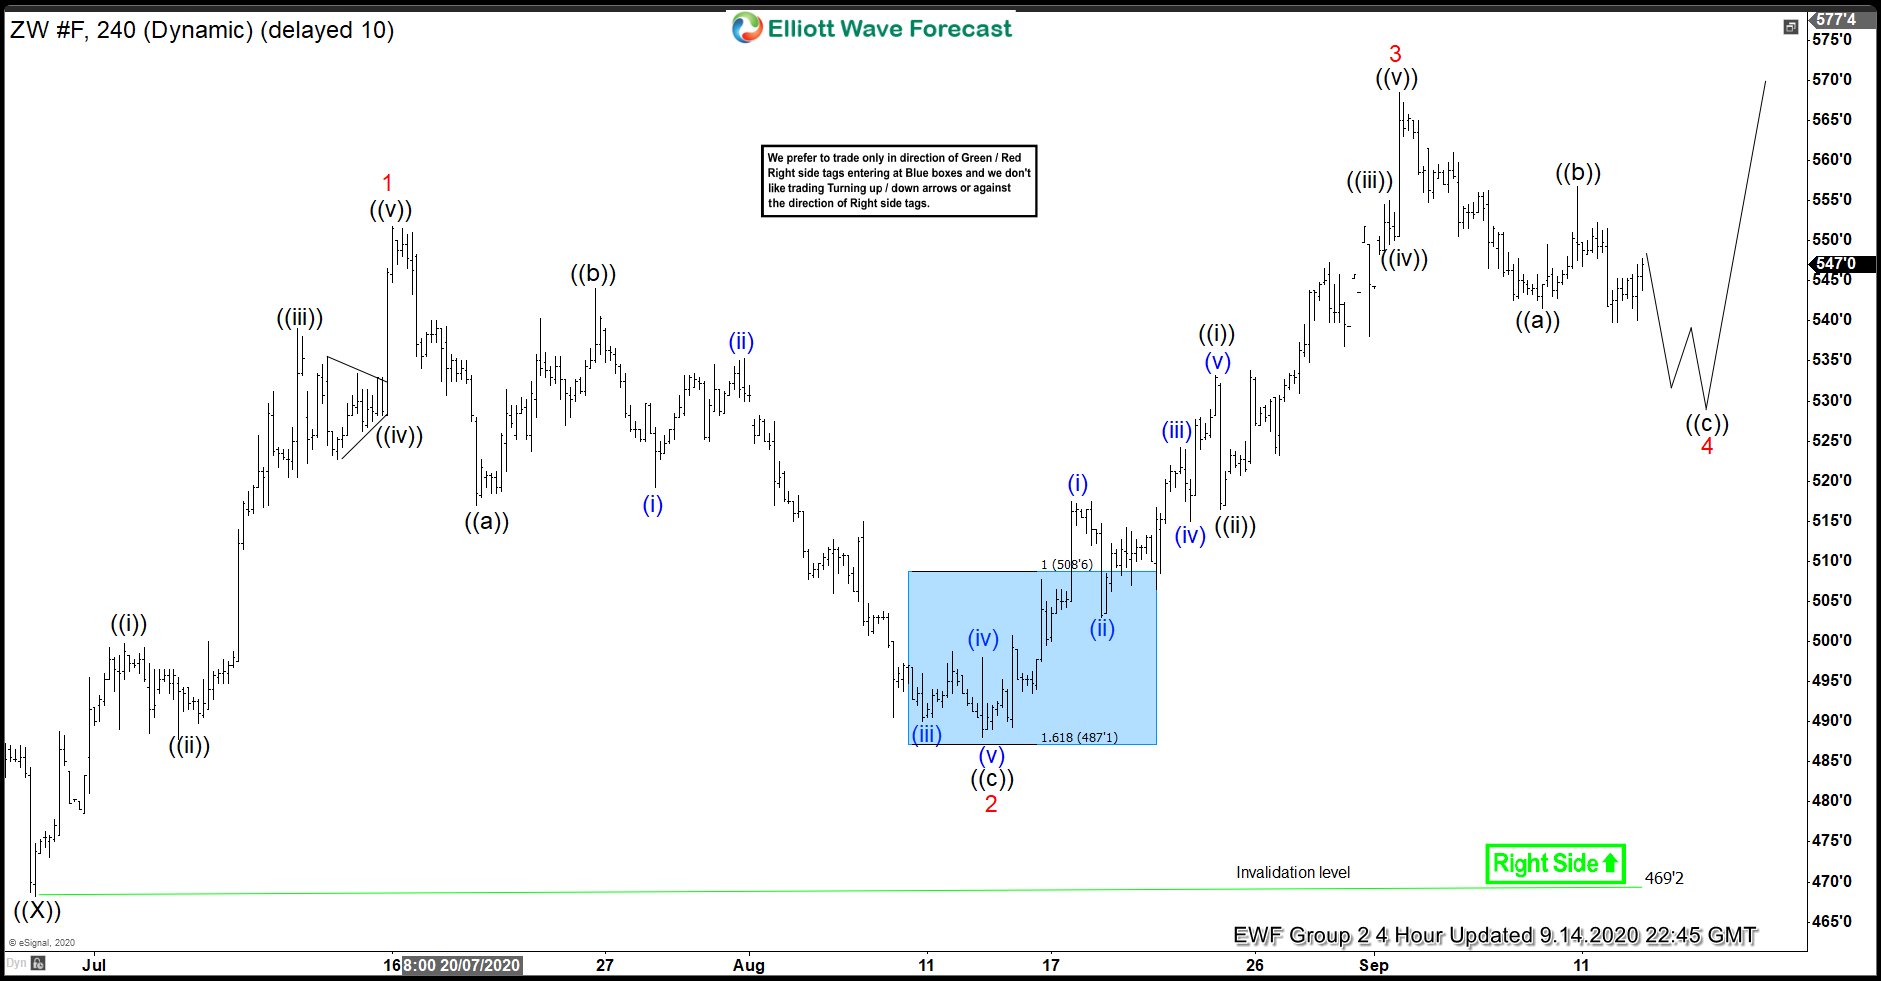
In this blog, we are going to take a look at the Elliott Wave chart of Wheat Futures (ZW_F). The 4 hour chart update from September 9 shows that wheat has ended the cycle from August 12 low as wave 3 at 568.4 high. A 3 waves pullback in wave 4 is expected to unfold before the commodity can continue to resume higher in wave 5 to end the cycle from June 27 low. Wave 4 pullback then unfolded as a zigzag correction. Down from wave 3 high, wave ((a)) ended at 541.4 low. The bounce in wave ((b)) ended at 556.6 high. The commodity then declined lower in wave ((c)). The 100-161.8% extension of wave ((a))-((b)) where ((c)) can potentially end is at 513-530 area, where if reached could see 3 waves bounce at least from there.
Wheat 9.14.2020 4 Hour Elliott Wave Chart
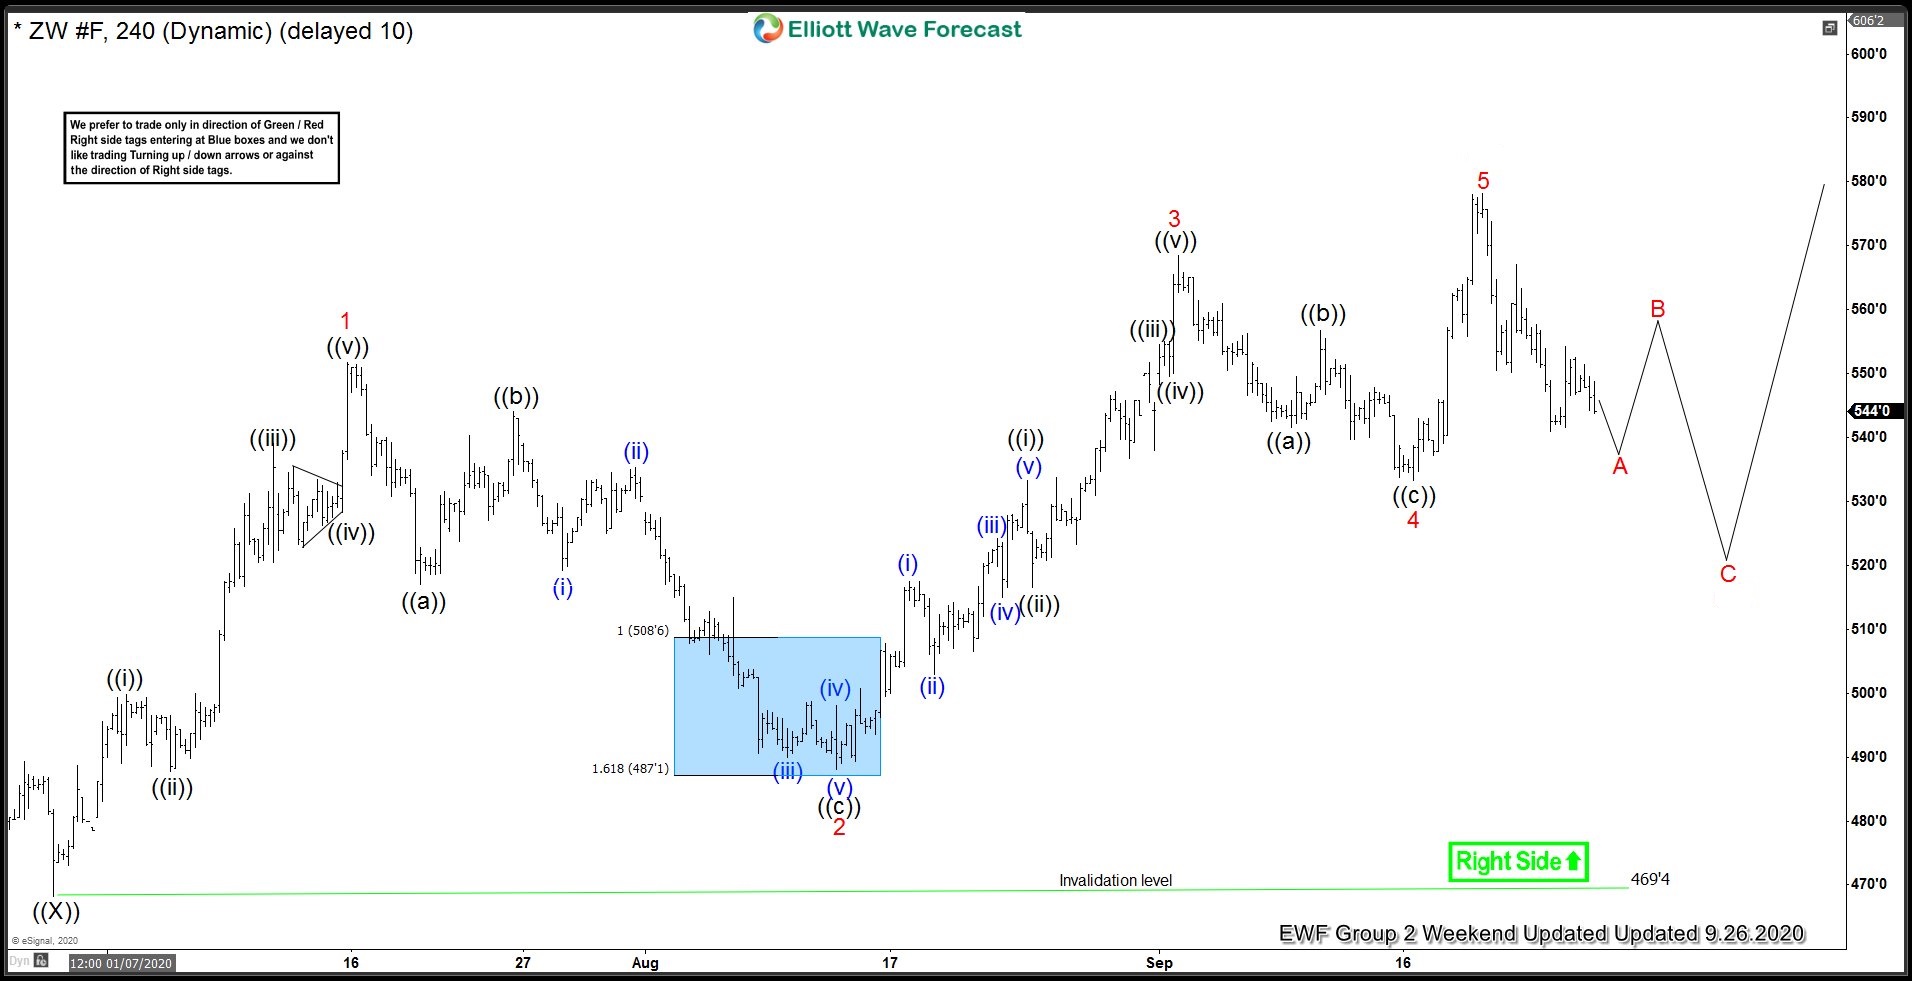
The 4 hour chart update from September 26 shows that wheat ended wave 4 pullback at 533.2 low. The correction truncated and did not reach the equal leg of ((a))-((b)) as expected. However, the commodity resumed the rally higher after that zigzag correction. The rally higher in wave 5 then ended at 578.2 high. This also ended the cycle from June 27 low. Currently, wheat can correct that cycle in 3,7 or 11 swings. This would be followed by another leg higher at least later. As long as the low at 469.4 stays intact, expect dips in 3,7 or 11 swings to find support for more upside later.
Wheat 9.26.2020 4 Hour Elliott Wave Chart