
In this technical blog we’re going to take a quick look at the Elliott Wave charts of NZDJPY, published in members area of the website. As our members know, NZDJPY has recently given us 3 waves pull back against the 68.73 low. That pull back has unfolded as Elliott Wave Zig Zag pattern ((a))((b))((c)). After it completed we got nice bounce higher as expected. In the further text we are going to explain the Elliott Wave Pattern and the Forecast.
Before we take a look at the real market example, let’s explain Elliott Wave Zigzag pattern.
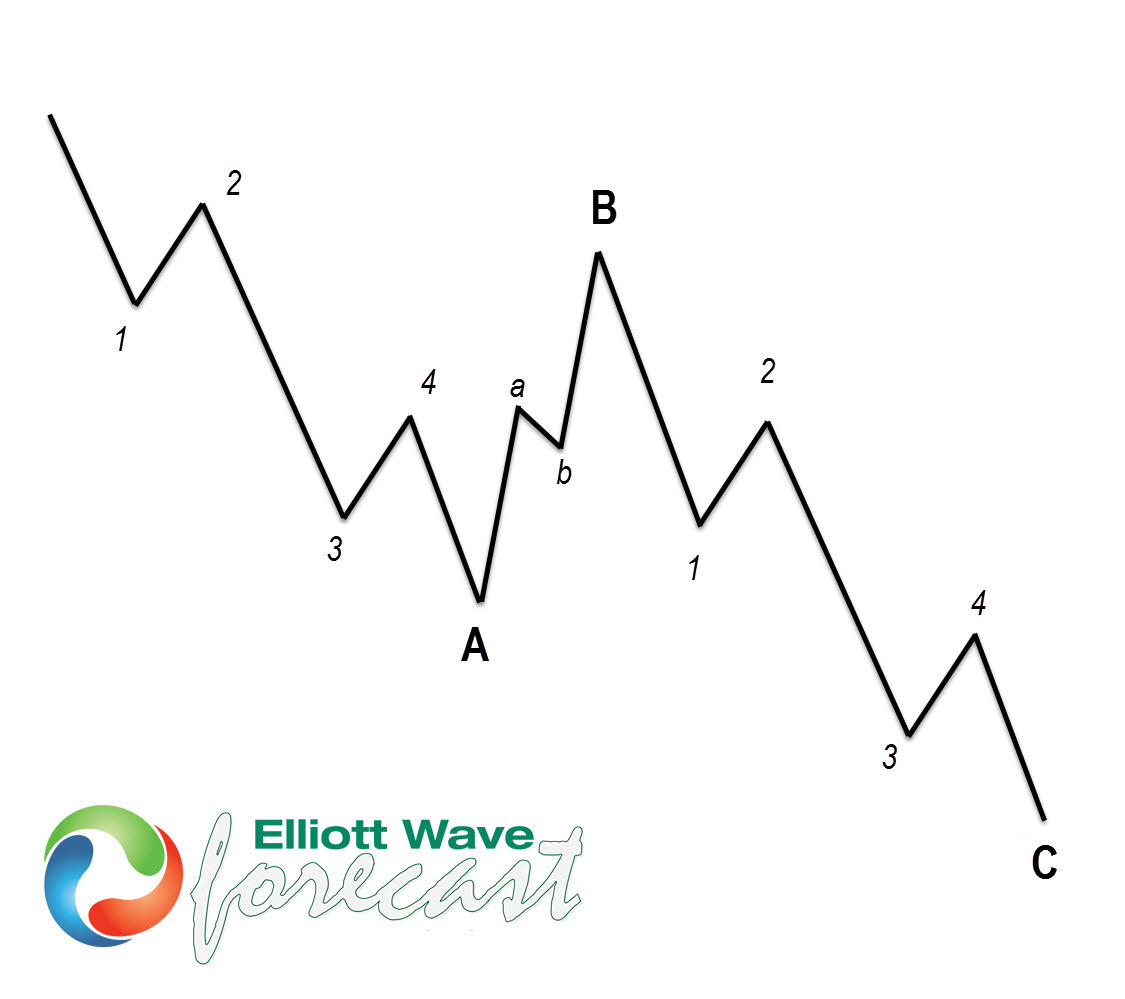
Elliott Wave Zigzag is the most popular corrective pattern in Elliott Wave theory . It’s made of 3 swings which have 5-3-5 inner structure. Inner swings are labeled as A,B,C where A =5 waves, B=3 waves and C=5 waves. That means A and C can be either impulsive waves or diagonals. (Leading Diagonal in case of wave A or Ending in case of wave C) . Waves A and C must meet all conditions of being 5 wave structure, such as: having RSI divergency between wave subdivisions, ideal Fibonacci extensions and ideal retracements.
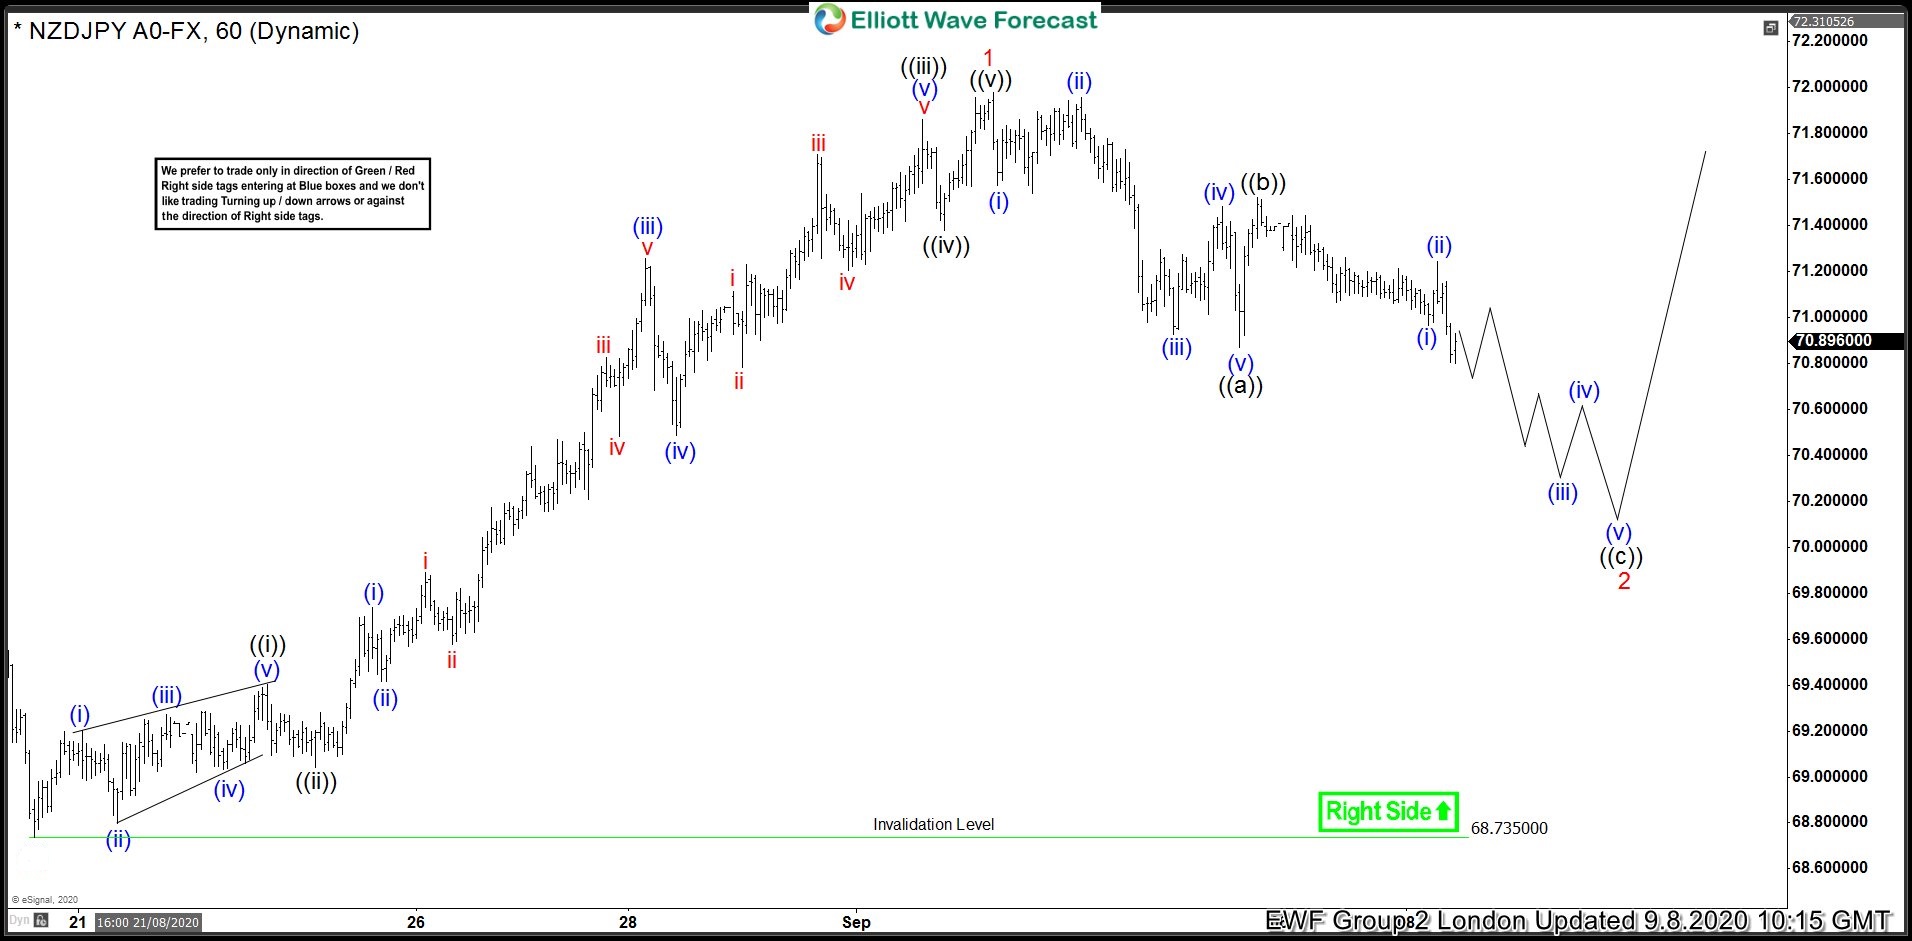
NZDJPY 1 Hour Elliott Wave Analysis 9.8.2020
Currently we are getting Wave 2 red pull back back against the June 68.73 low. Correction still looks incomplete at the moment . We can see the price is showing lower low sequences from the peak,suggesting we can get more short term weakness before turn happens. First leg ((a)) black unfolded as 5 waves down from the peak. Then we got 3 wave bounces in wave ((b)) and finally, we’re doing last leg down ((c)) black. We expect to see 5 waves down n ((c)) leg as well. Pull back should ideally complete at 70.43- 69.76 area , which is equal legs ((a))-((b)). We don’t recommend selling the pair and favor the long side against the 68.73 low.
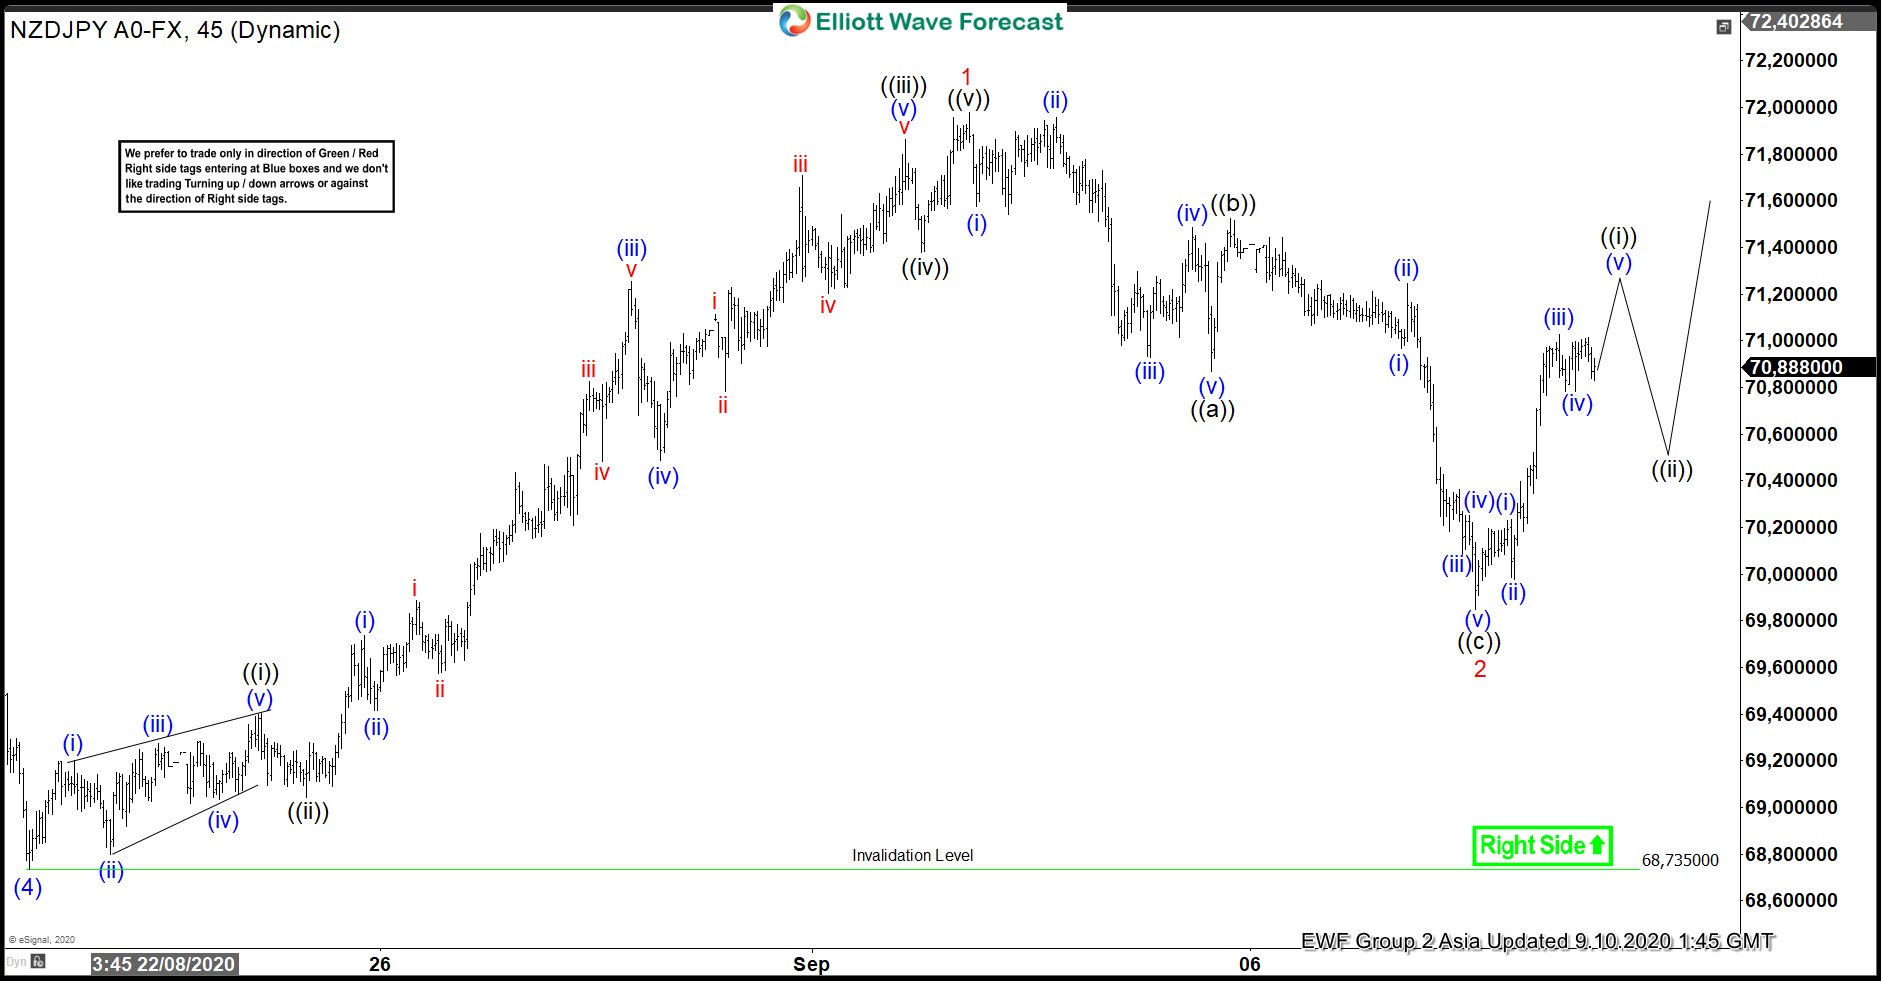
NZDJPY 1 Hour Elliott Wave Analysis 9.10.2020
We got 5 waves down in wave ((c)) as expected. Pull back reached ((a))-((b)) equal legs 70.43- 69.76 and started bouncing . The pair needs to see break above 09/02 ( 1 red) peak in order to confirm next leg up is in progress. We expect short term rally to complete soon as 5 waves – wave ((i)) black, before ((ii)) takes place. Anyway we don’t recommend selling the pair in any proposed pull back
NZDJPY 1 Hour Elliott Wave Analysis 9.15.2020
Eventually we got ((ii)) pull back that ended at 70.426 low. After short term consolidation we got new short term high which now makes pair supported against the 70.426 low.As far as the mentioned low holds next technical zone to the upside comes at 71.75-72.06. Alternatively if 70.42 pivot gives up, we can still be in ((ii)) which might be unfolding as irregular flat.
Keep in mind market is dynamic and presented view could have changed in the mean time. You can check most recent charts in the membership area of the site. Best instruments to trade are those having incomplete bullish or bearish swings sequences.We put them in Sequence Report and best among them are shown in the Live Trading Room

Elliott Wave Forecast