
Hello fellow traders. In this technical blog we’re going to take a quick look at the Elliott Wave charts of EURJPY, published in members area of the website. As our members know, EURJPY is showing higher high sequences in the cycle from the May 6th low. Consequently we’ve been calling rally in EURJPY since the pair broke June 5th peak. The pair made pull back that has unfolded as Elliott Wave Zig Zag pattern In the further text we are going to explain the Elliott Wave Pattern and the Forecast.
Before we take a look at the real market example, let’s explain Elliott Wave Zigzag pattern.
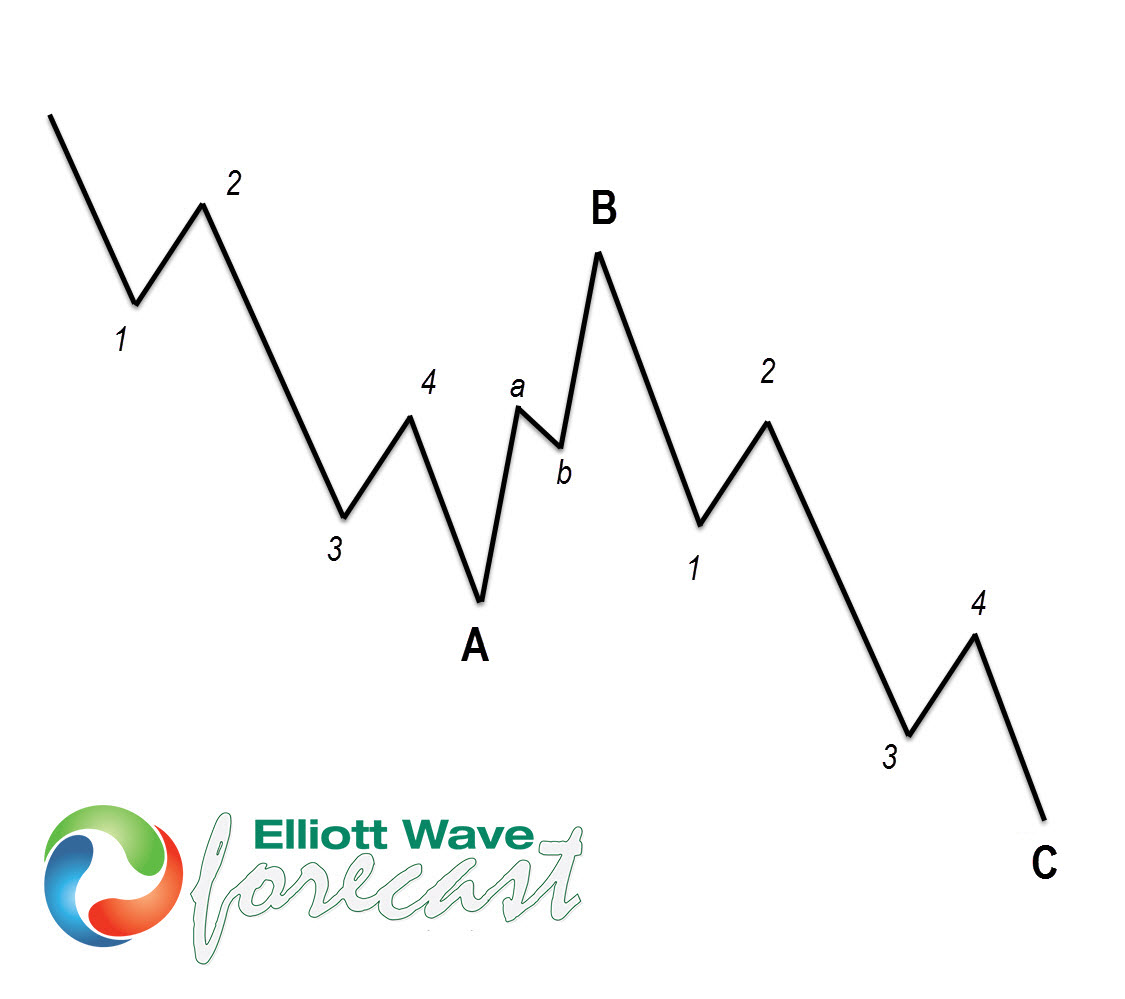
Elliott Wave Zigzag is the most popular corrective pattern in Elliott Wave theory . It’s made of 3 swings which have 5-3-5 inner structure. Inner swings are labeled as A,B,C where A =5 waves, B=3 waves and C=5 waves. That means A and C can be either impulsive waves or diagonals. (Leading Diagonal in case of wave A or Ending in case of wave C) . Waves A and C must meet all conditions of being 5 wave structure, such as: having RSI divergency between wave subdivisions, ideal Fibonacci extensions and ideal retracement.
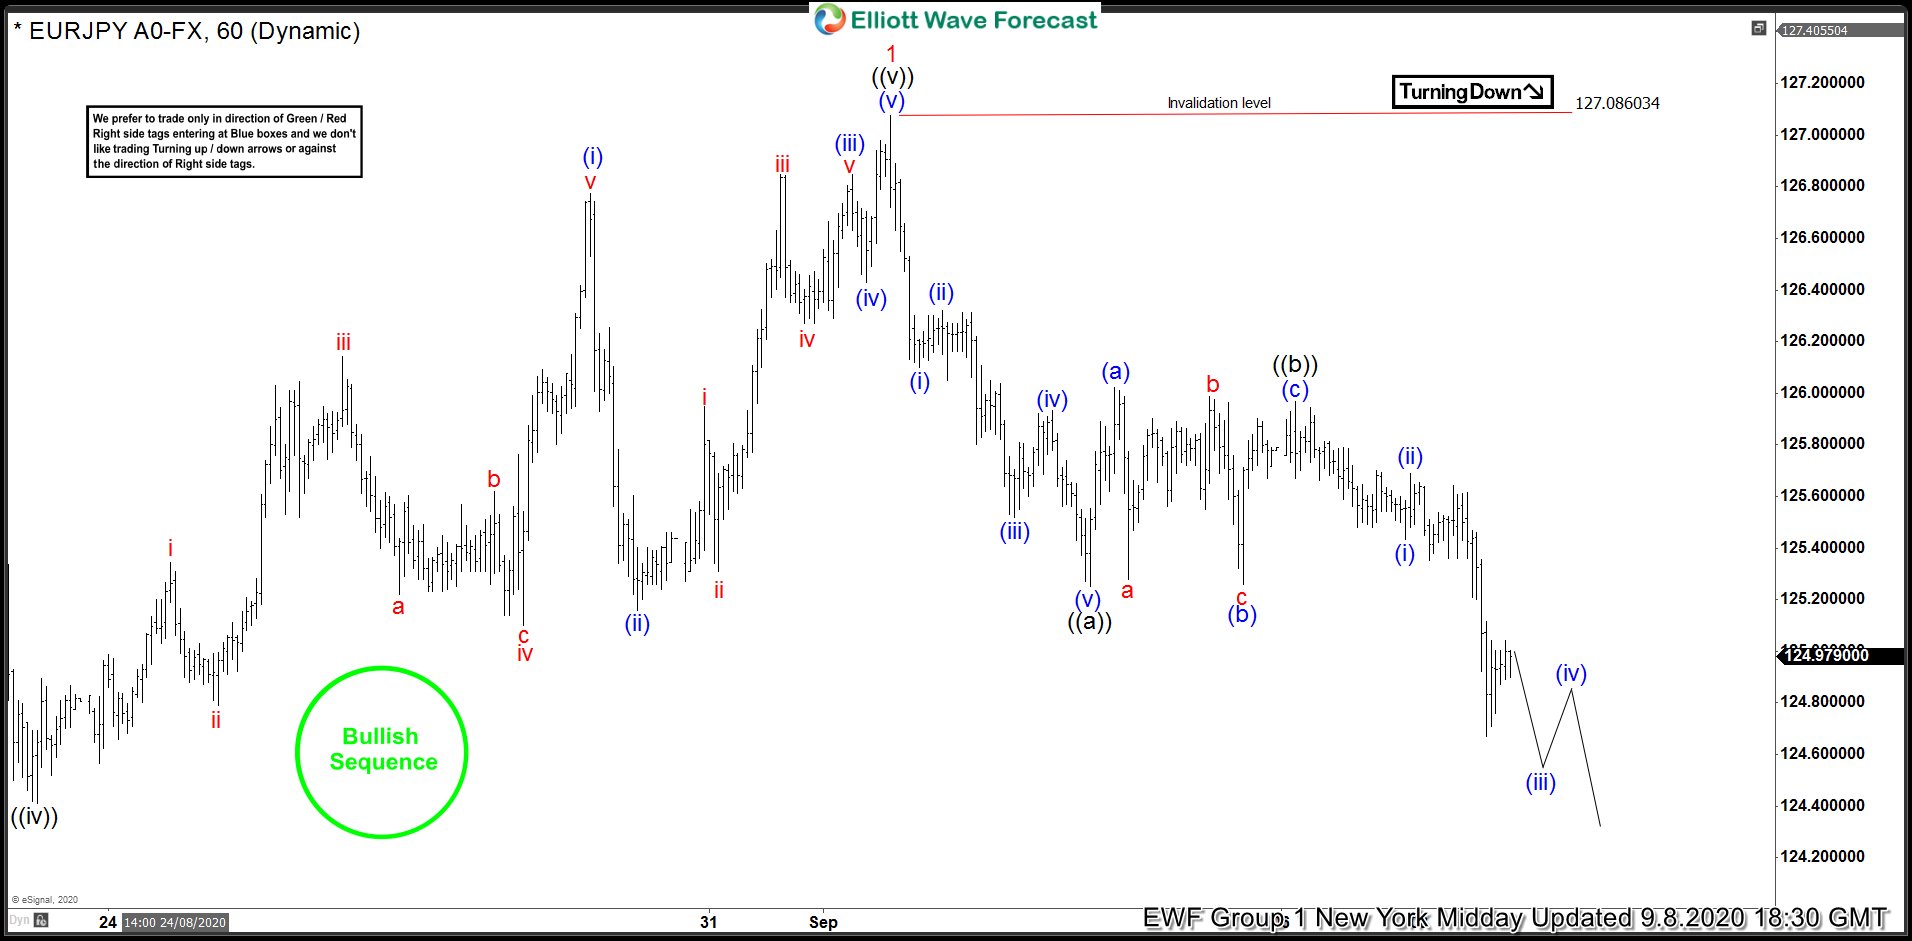
EURJPY 1h Hour Elliott Wave Analysis 9.8.2020
The pair is trading within the cycle from the 06/22 low. Currently we are getting Wave 2 red pull back that has for of Elliott Wave Zig Zag pattern. So far we got 5 waves down from the 127.086 peak, that is labeled as wave ((a)). Then we got 3 waves bounce in ((b)) short term recovery and breaks toward new lows. Correction still looks incomplete at the moment, suggesting we can get more short term weakness before rally takes place toward new highs.We expect to see at least another marginal push lower to have 5 waves in ((c)) leg as well.
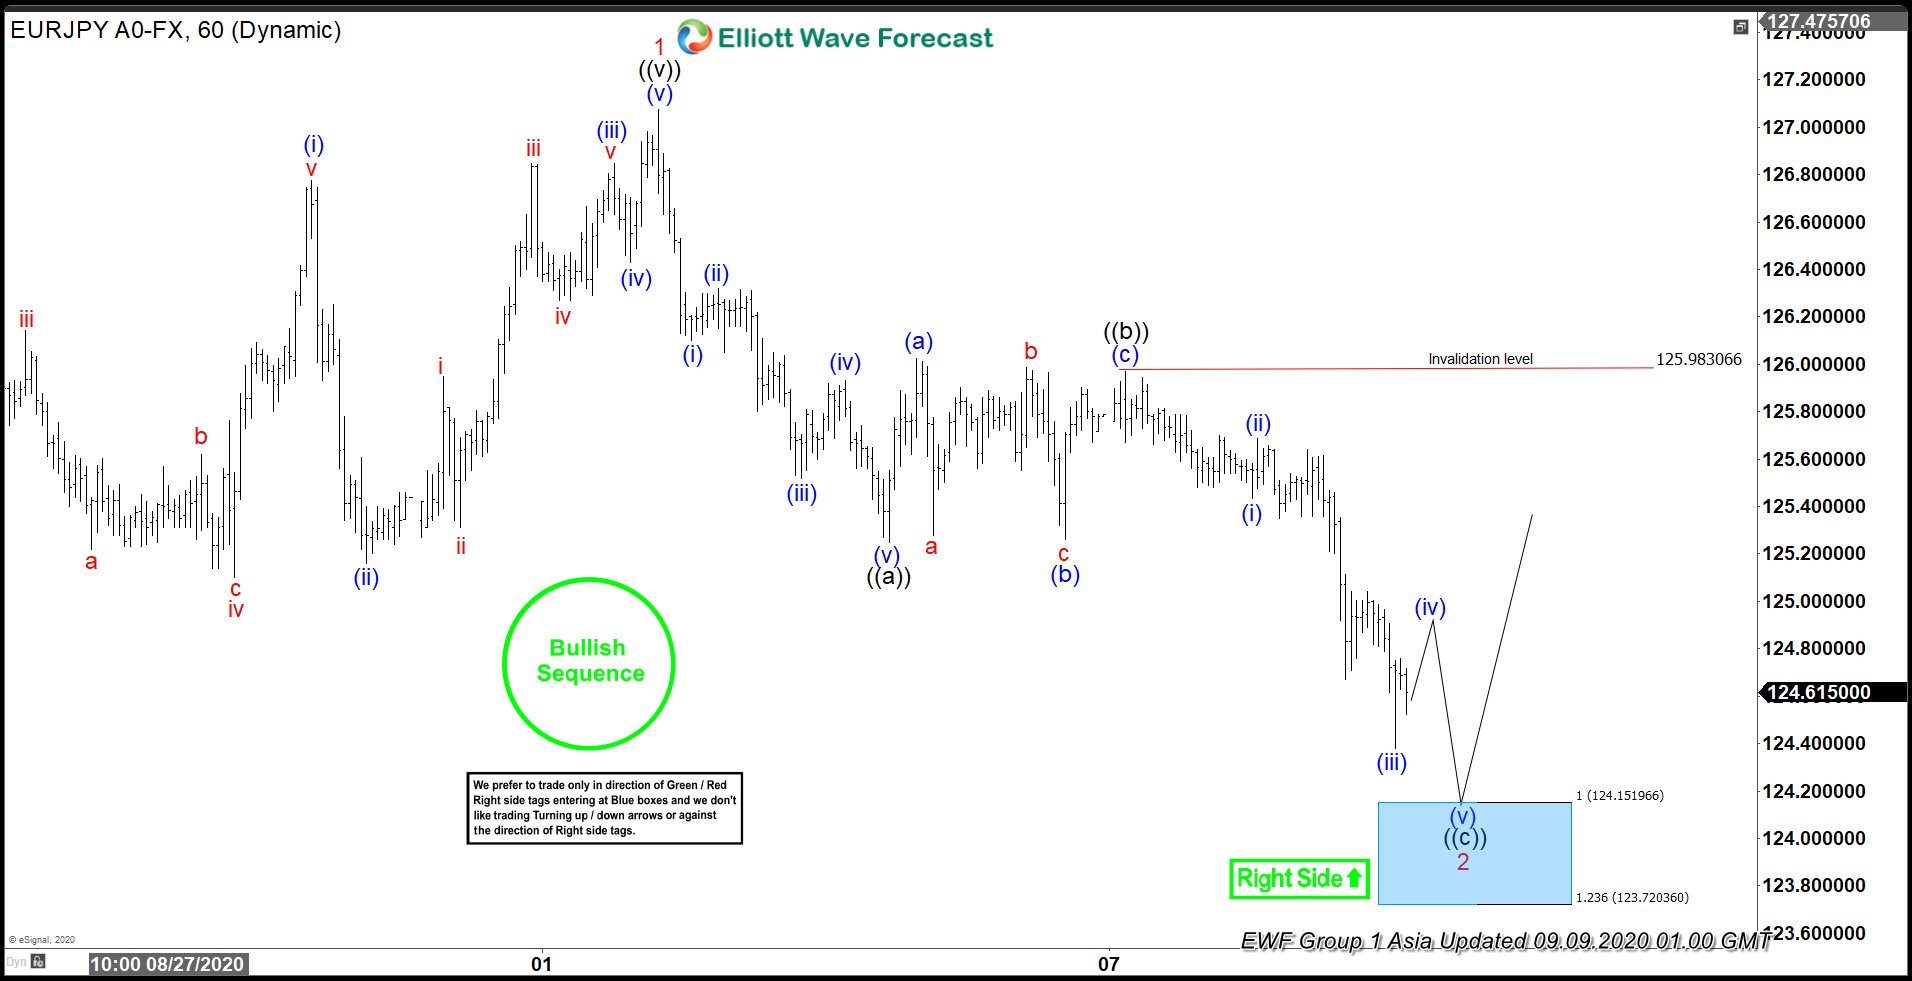
EURJPY 1h Hour Elliott Wave Analysis 9.9.2020
The pair is still doing wave 2 red pull back that is unfolding as Elliott Wave Zig Zag pattern. Although current decline from the 125.98 peak can be counted as 5 waves, we believe another leg down would be ideal as equal legs ((a))-((b)) has not been reached yet. So current bounce can be unfolding as (iv). As far as 125.98 pivot holds we can get another leg down down toward 124.151-123.72 area. At that zone we would like to be buyers for proposed rally toward new highs or 3 waves bounce at least. We don’t recommend selling the pair at this stage.
You can learn more about Zig Zag Elliott Wave Patterns at our Free Elliott Wave Educational Web Page.
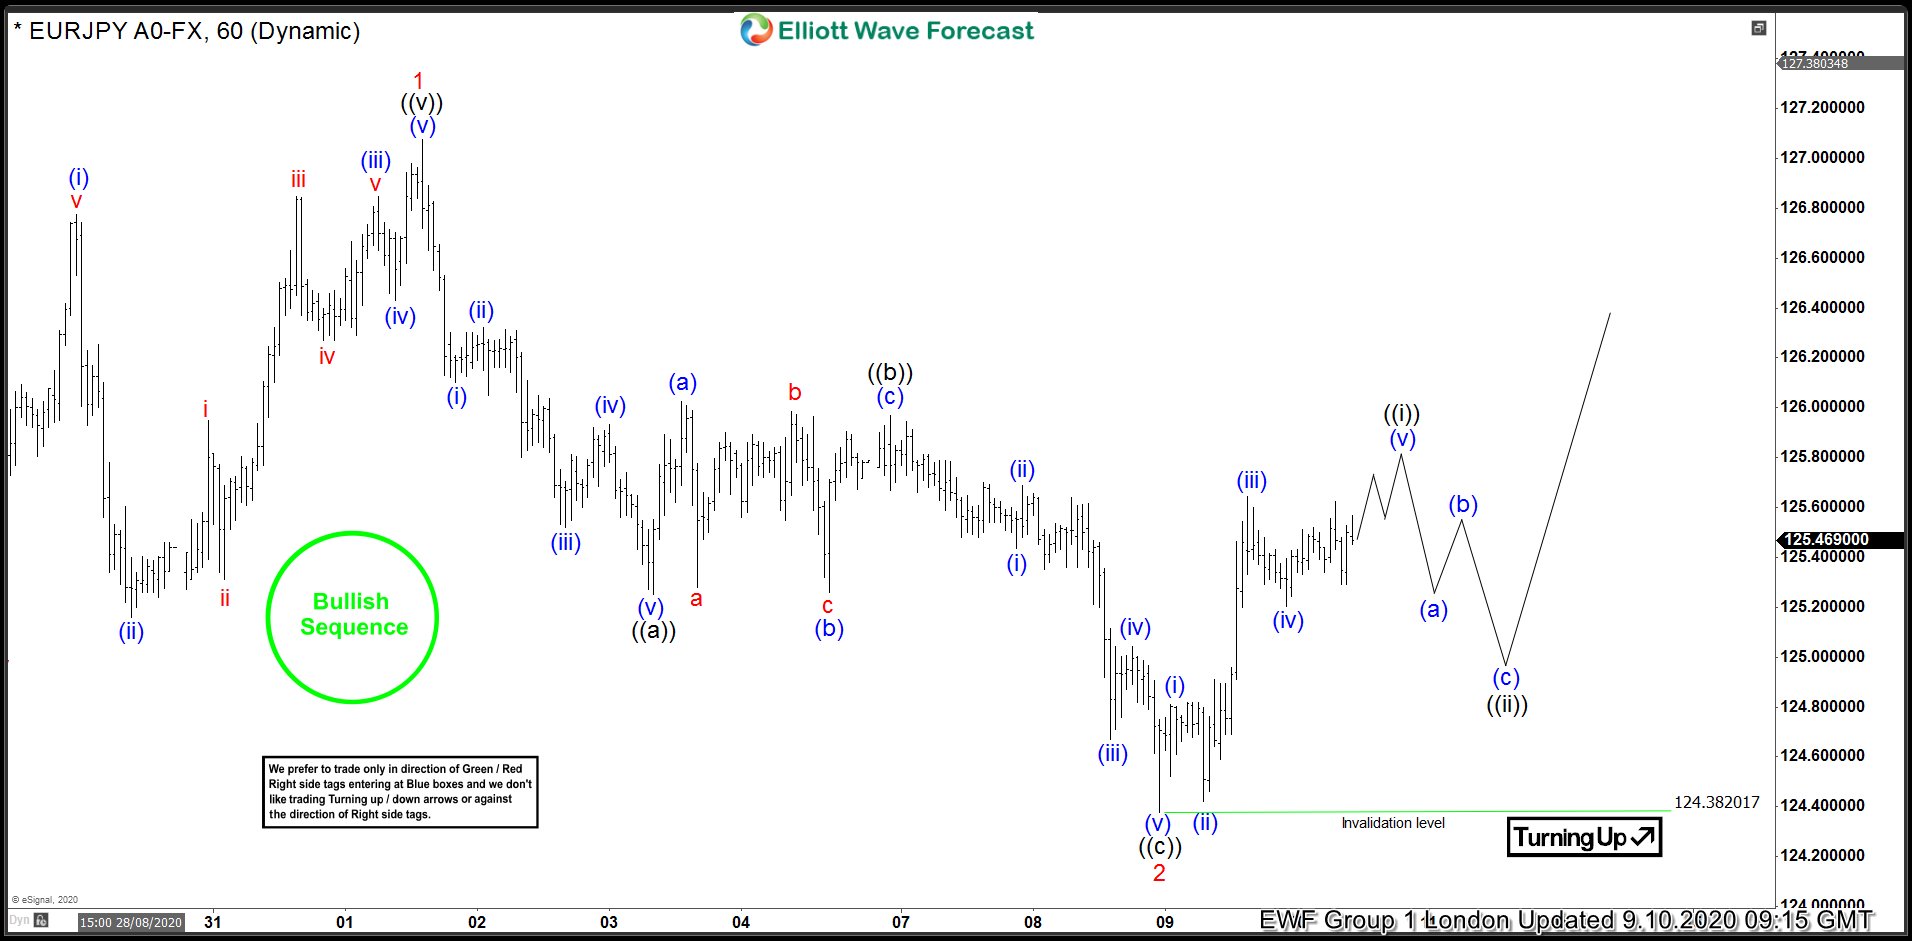
EURJPY 1h Hour Elliott Wave Analysis 9.10.2020
In the mean time we got stronger bounce than expected. Buyers were strong enough to break 125.98 pivot. At this stage we call Elliott Wave Zig Zag completed at the 124.38 low. Unfortunately this equal legs hasn’t been reached, and we didn’t get chance to enter the trade. Pull back ended as truncation. Now as far as the price holds above 124.38 low, we can get further extension up. The pair needs to see break above 09/07 peak in order to confirm next leg up is in progress. Then we will look for new potential buying opportunity. Anyway we don’t recommend selling the pair in any proposed pull back and expect further strength due to incomplete sequences from the May low.
Keep in mind market is dynamic and presented view could have changed in the mean time. You can check most recent charts in the membership area of the site. Best instruments to trade are those having incomplete bullish or bearish swings sequences.We put them in Sequence Report and best among them are shown in the Live Trading Room
Elliott Wave Forecast