
Technology is the strongest sector in the current bullish trend in World Indices. Nasdaq (NQ) which has a lot of technology stocks naturally is one of the best performing Indices. We had some pullback in the Indices last week. As always, with every pullback, many traders and analysts start to speculate if major top is in place.
We will look at the chart of Nasdaq to answer this question. We start with the idea that Nasdaq is in an impulsive structure from all-time low. That should be very clear as the Index makes new all-time high and continues to make higher high. For an impulsive structure to end, we need to be able to count a clear 5 waves. In addition, we should see the fifth wave losing momentum and thus we need to be able to observe a momentum divergence.
Let’s now look at the Daily Chart of Nasdaq below and focus especially on the rally from March 2020 low.
Nasdaq Daily Elliott Wave Chart: Path 1
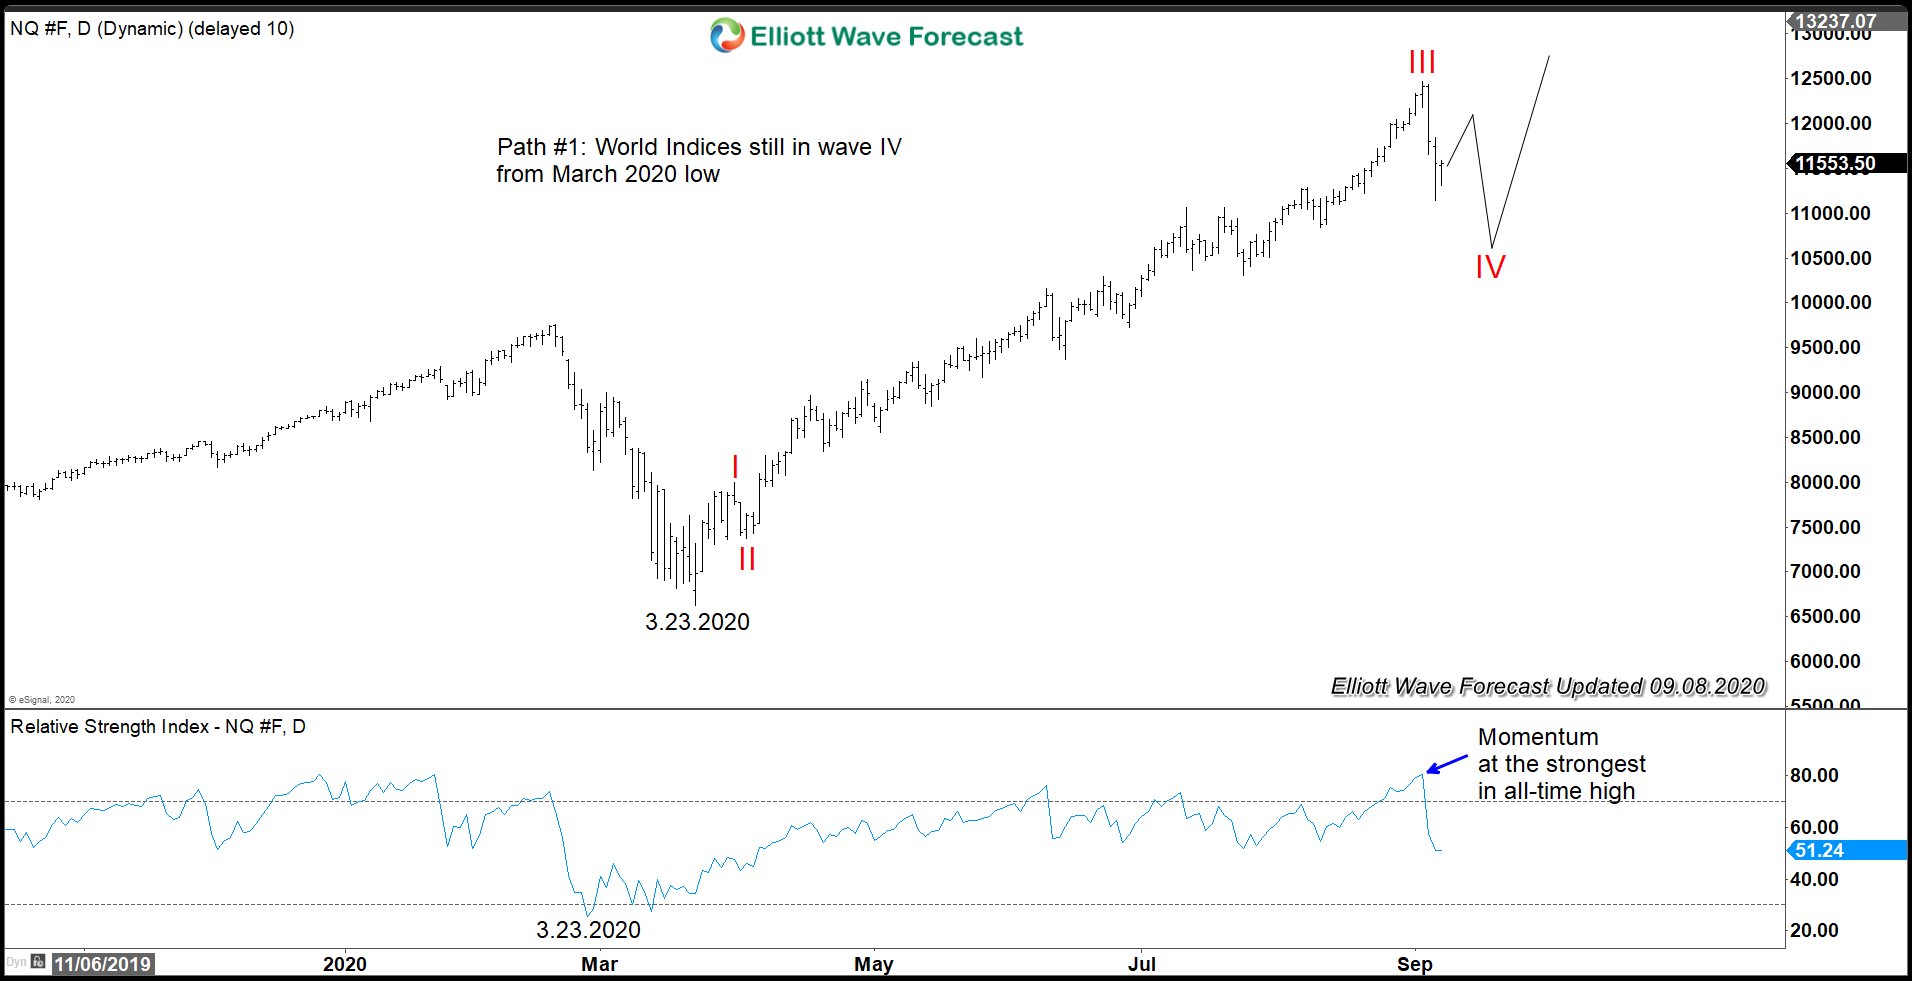
In the daily chart above, we can see the all-time high in Nasdaq came without any momentum divergence. The RSI (Relative Strength Index) shows the strongest momentum peak at the same time when the Index makes all-time high. Thus, we can conclude that the previous all-time high is unlikely to be a wave V from March 23 low. One possibility then is to label the previous all-time high to be wave III. In this scenario, the Index should be in wave IV in 3, 7, or 11 swing before it resumes higher again.
Assuming the placement of wave I and II is correct, potential target for wave IV is 23.6 – 38.2 Fibonacci retracement of wave III which is 10508 – 11249. This is a guideline for where wave IV usually ends, but not a rule. Also as a guideline, it’s better for wave IV not to retrace more than 50% of wave III or else it becomes too big and no longer be a wave IV. A 50% retracement of wave III is 9910. Nasdaq last week has already hit 23.6 retracement at 11249. Thus in fact, the Index can start to make new high again from here. However, it can still do a double correction and perhaps reach around 38.2 retracement at 10508 area before ending wave IV and resumes higher again.
Nasdaq Daily Elliott Wave Chart: Path 2
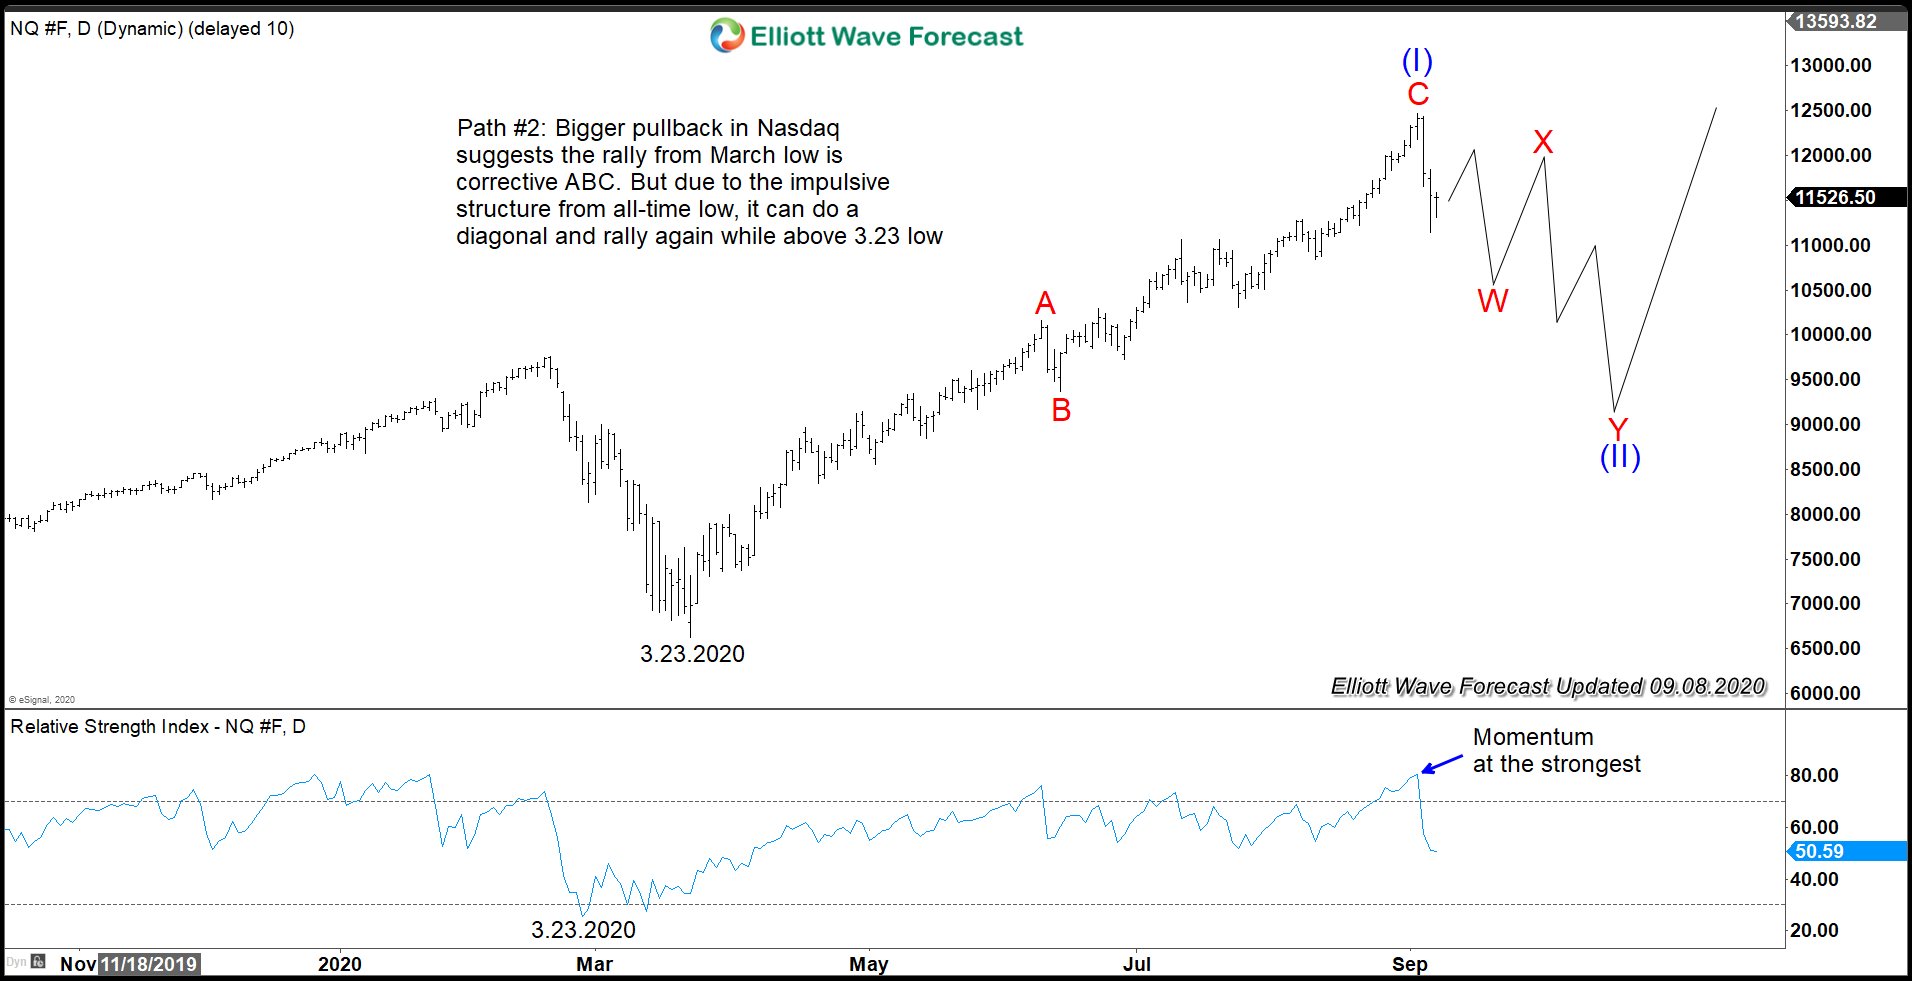
Let’s assume for a moment that Nasdaq is doing larger decline. If it drops more than the proposed 50% of wave III at 9910 like the first chart above suggests, it will increase the chance it’s no longer a wave IV. In this scenario, Nasdaq perhaps has ended cycle from March 23 low as a corrective structure ABC. The reason is because there’s no momentum divergence at the peak and thus the structure of the rally is likely not a 5 waves.
However, since Nasdaq is at all-time high and thus the entire rally from all-time low has to be impulsive, the Index can’t possibly end the entire impulsive structure with 3 waves structure. Thus, in case of a bigger pullback, another path can be that Nasdaq rally from 3.23.2020 low is in an ending diagonal structure. In this case, the rally from 3.23 low ended wave (I). We can then see a larger pullback in wave (II) to correct cycle from March low before Index resumes higher again.