Elliott Wave View of S&P 500 (SPX) suggests the rally from July 25,2020 low has ended at 3399.54 high as wave 3, which is also a new all-time high. Up from July 25 low, wave ((i)) ended at 3264.74 high and wave ((ii)) dip ended at 3204.13 low. Index then extended higher in wave ((iii)) towards 3381.01 high. The internal subdivision of wave ((iii)) unfolded as 5 waves impulse Elliott Wave Structure. Wave (i) of ((iii)) ended at 3264.74 high and wave (ii) pullback ended at 3220.26 low. Rally higher in wave (iii) then ended at 3351.92 high, followed by wave (iv) pullback, which ended at 3328.72 low. Wave (v) then extended higher and ended at 3381.01 high.
Afterwards, the Index did a pullback in wave ((iv)), which ended at 3326.44 low. Finally, wave ((v)) higher ended at 3399.54 high. This final move completed wave 3 in higher degree and ended cycle from July 25 low. Index is currently correcting that cycle within wave 4. The correction is unfolding as a zigzag correction, where wave ((a)) is currently in progress. The bounce in wave ((b)) should follow before another leg lower in wave ((c)) to end wave 4. As long as 3199.50 low stays intact, expect the dips in 3,7 or 11 swings to find support for more upside.
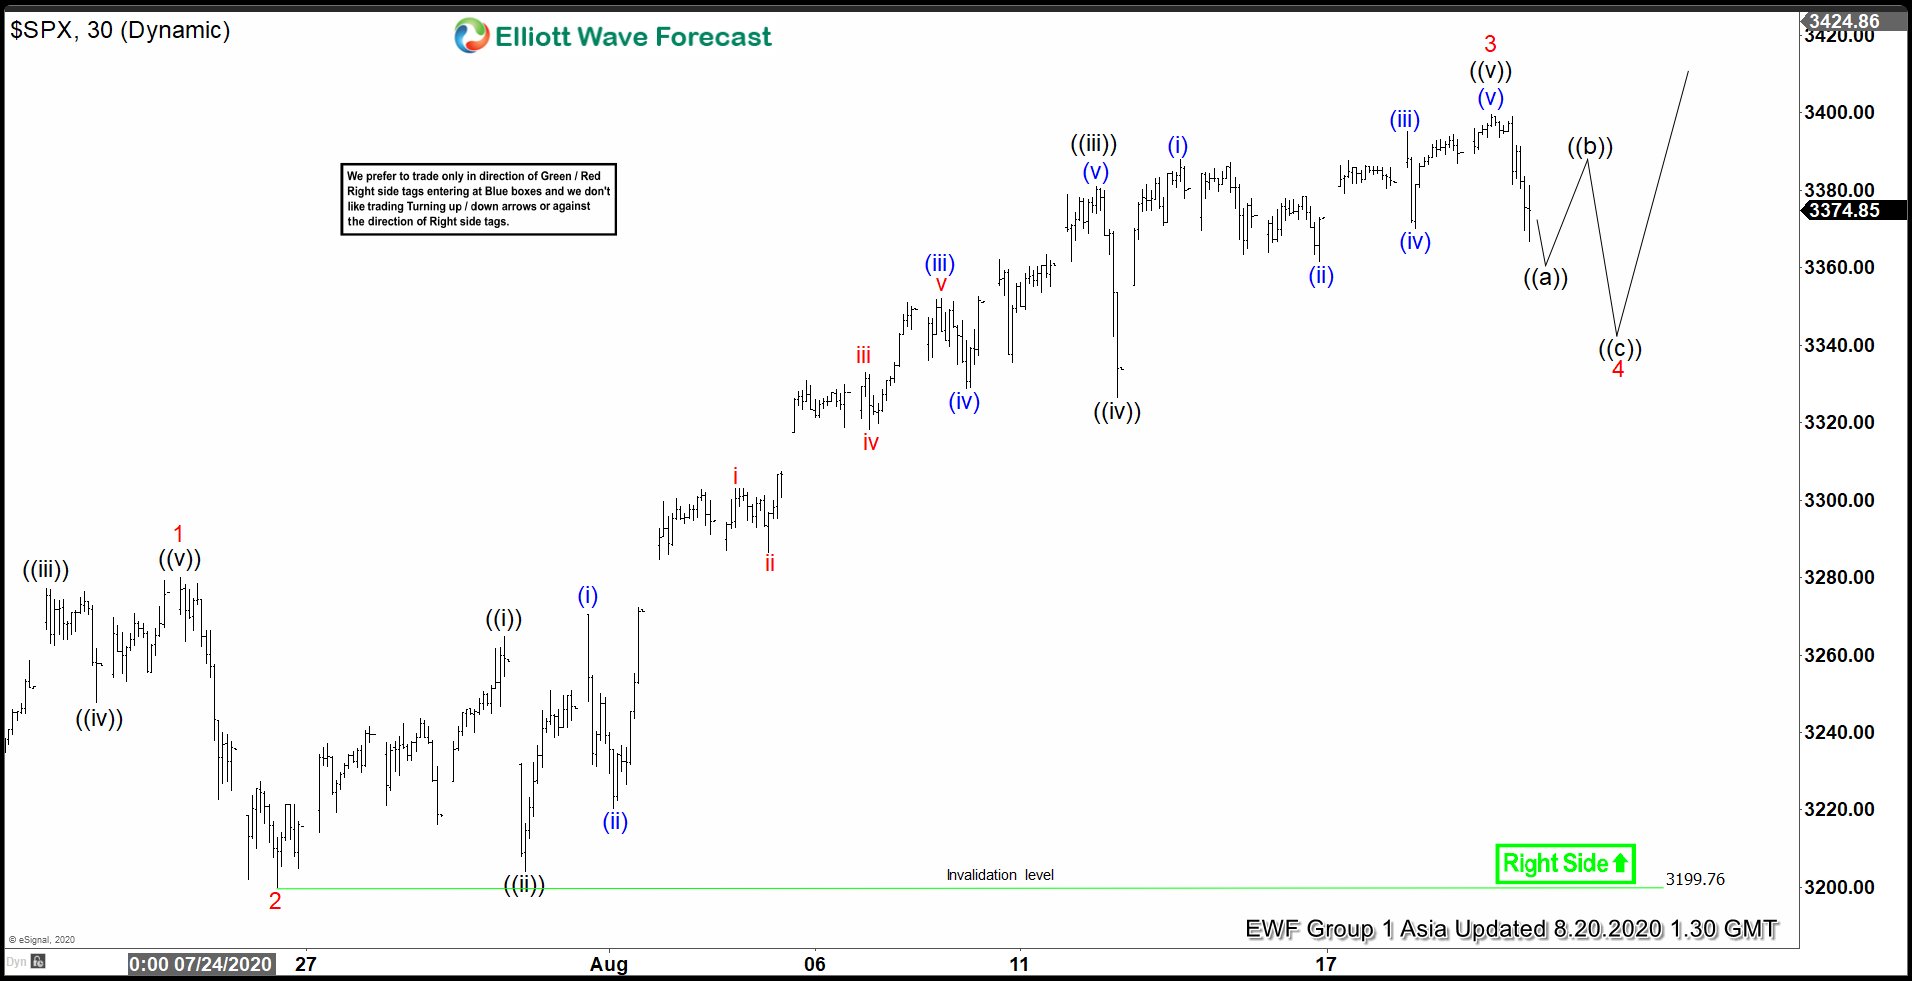
SPX 30 Minutes Elliott Wave Chart