Rio Tinto Group is the world’s second largest metals and mining corporation which has its headquarters in London and Melbourne. Founded in 1873 and traded under tickers $RIO at LSE, ASE and also in US in form of ADRs, it is a component of both the FTSE100 and ASX200 indices. In terms of operations, Rio Tinto is producing iron ore, copper, diamonds, gold and uranium. Besides its primary role as a minerals’ extractor, the company is active significantly in refining of bauxite and iron ore. Currently, commodities are turning up. Therefore, mining companies in general become a good choice within the spectrum of investment opportunities. Hereby, Rio Tinto Group as a well established corporation and a market leader should be included without any doubt in every investor’s portfolio.
Rio Tinto Monthly Elliott Wave Analysis 08.13.2020
The monthly chart below shows the Rio Tinto stock $RIO at ASE. From the all-time lows, the stock price has developed a cycle higher in wave (I) of a super cycle degree. Hereby, Rio Tinto has printed the all-time highs on May 2008 at 124.19. The cycle up is an impulsive move; it shows 5 subwaves of a cycle degree and an extension within the wave III. From the 2008 highs, a correction lower has unfolded as a straightdown decline in the blue wave (II). It has ended correcting the previous grand super cycle by printing an important bottom in December 2008 at 23.57.
From the 2008 lows at 23.57, a new cycle in wave (III) has most probably started. Breaking above 124.19 would confirm another extension higher. In shorter cycles, the advance towards February 2011 highs at 89.04 can be seen as a leading diagonal in a red wave I. Thereafter, decline lower towards February 2016 lows at 36.15 is a double three in a red wave II of a cycle degree.

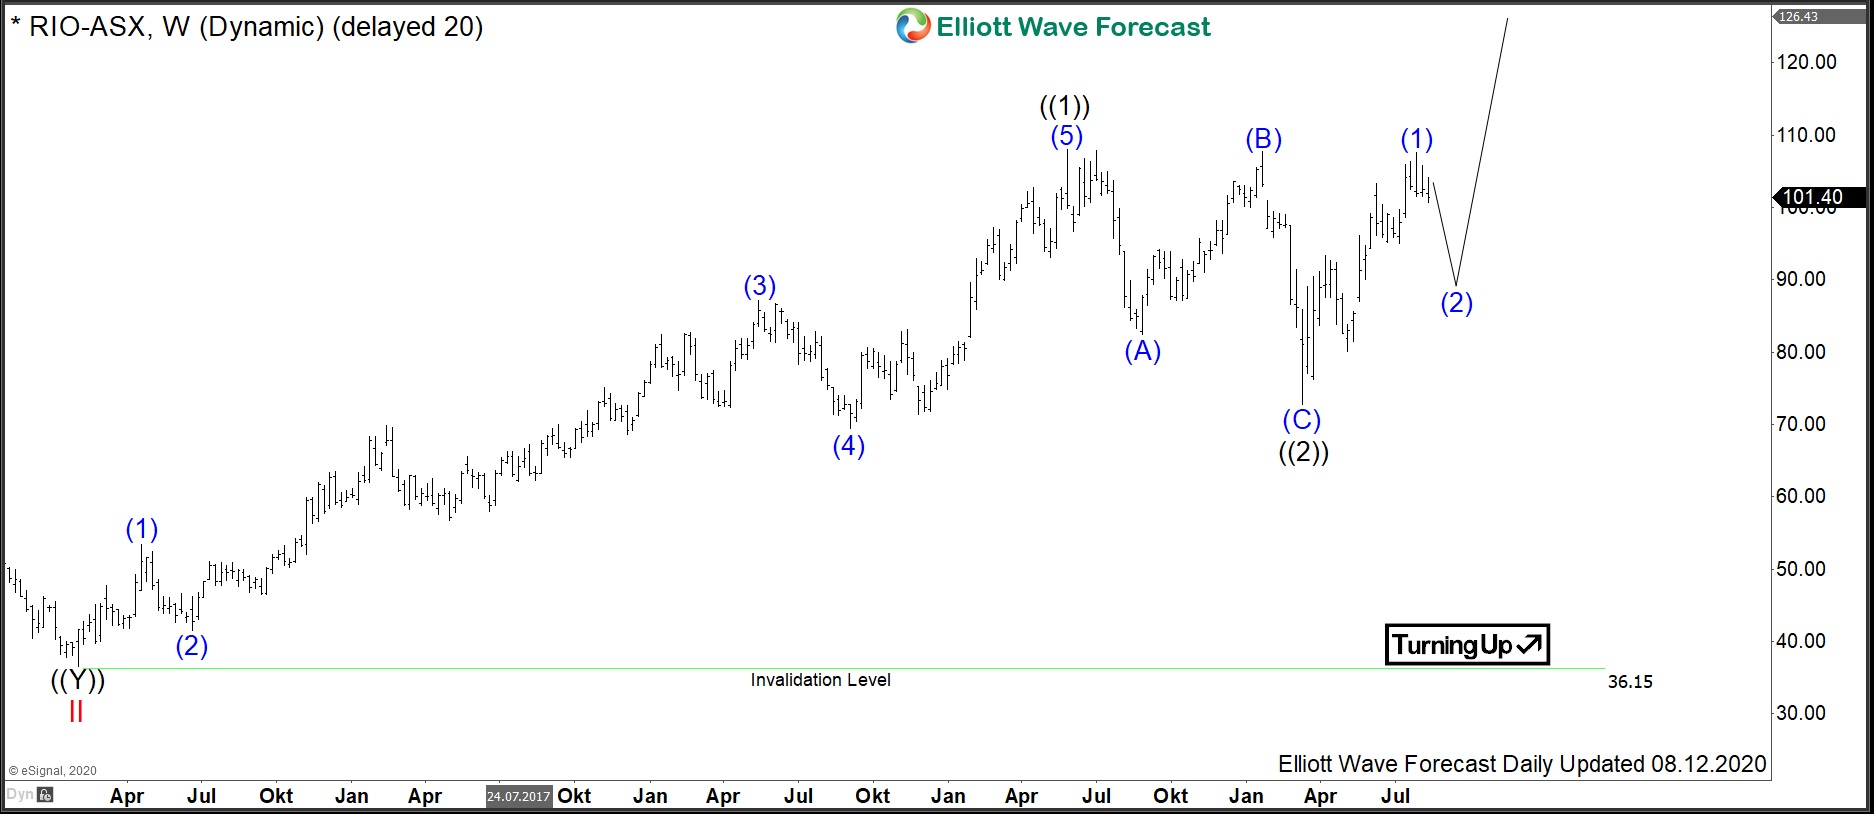
Rio Tinto Weekly Elliott Wave Analysis 08.13.2020
The weekly chart below shows the $RIO shares price action in more detail. From the February 2016 lows at 36.15, the stock price has advanced and broken 89.04 highs confirming that the wave III is in progress. In particular, Rio Tinto has developed a cycle higher in wave ((1)) towards May 2019 highs at 107.94. From the highs, a correction lower has unfolded as an expanded flat structure in wave ((2)) towards March 2020 lows at 72.69.
From the lows, wave ((3)) of III may be already in progress. Ideally, the price should break 107.94 to confirm that. Otherwise, one can not outrule a double correction lower in wave ((2)).
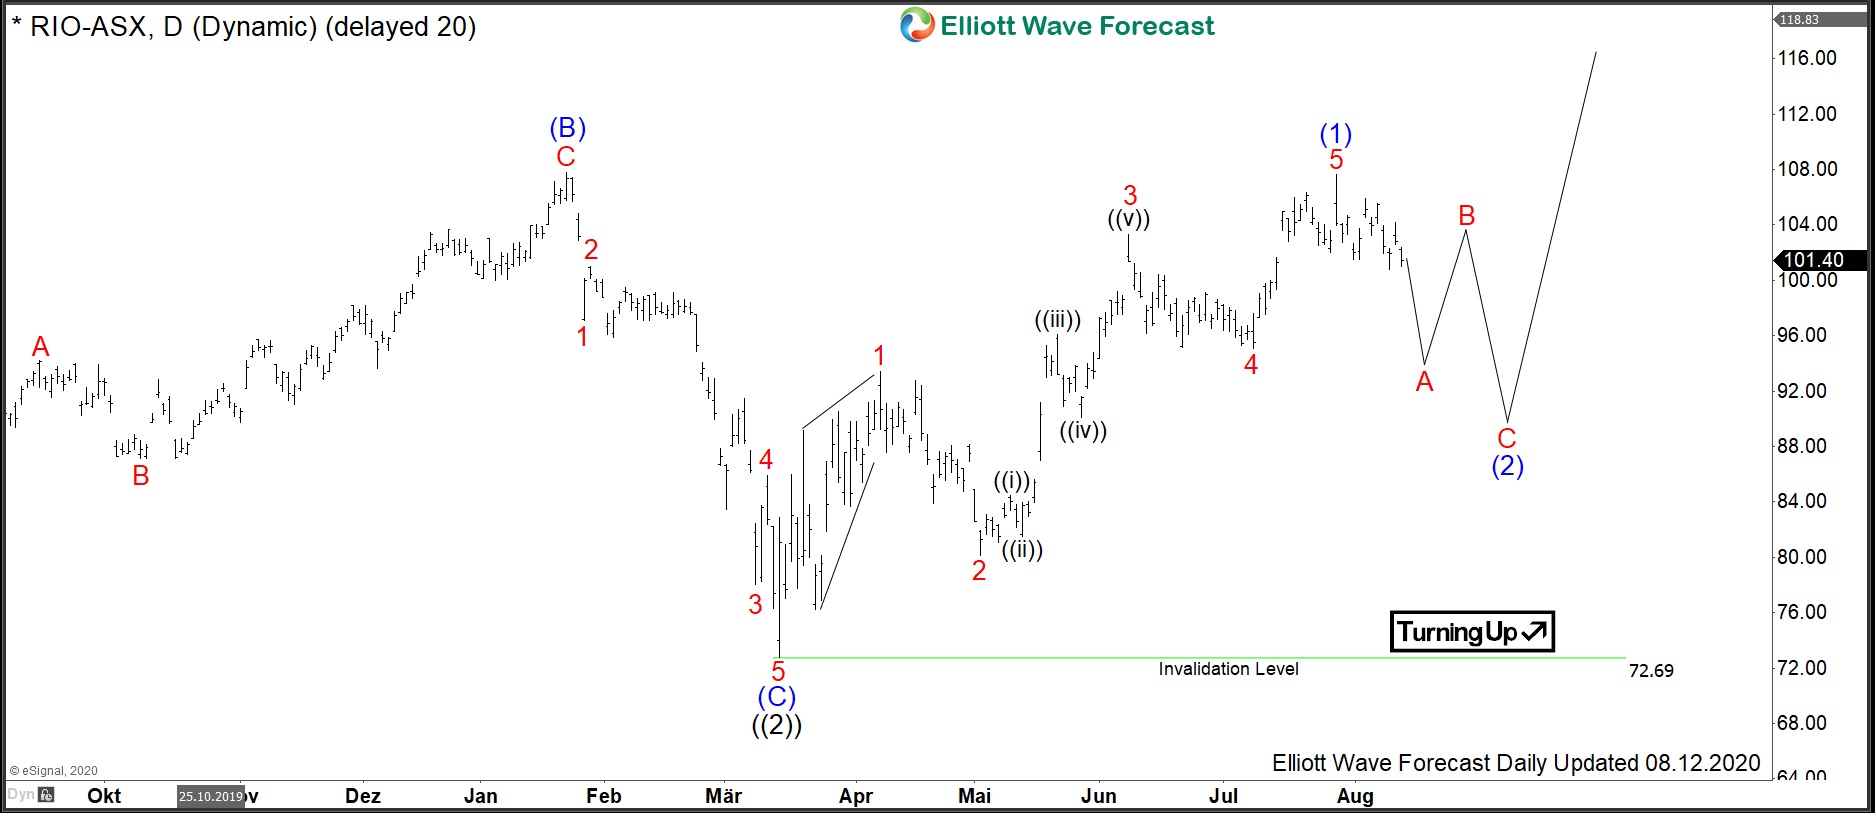
Rio Tinto Daily Elliott Wave Analysis 08.13.2020
The daily view demonstrates the advance from the March lows in wave (1) of ((3)). Obviously, it is showing 5 waves up. There is a separation within wave ((iii)) of 3 which qualifies the wave (1) as an impulse. It also supports the bullish view. Currently, the stock price has broken the RSI trendline lower. Therefore, the cycle higher in wave (1) might be finished and a correction lower in wave (2) should find support in 3, 7 or 11 swings above March lows at 72.69.
Then, an extension higher in wave (3) of ((3)) to new highs should follow or $RIO should produce another leg higher at least. Based on the length of the wave (1), the price target to the upside will be 144.40-188.70. Consequently, the wave (3) can extend towards that area and even beyond.