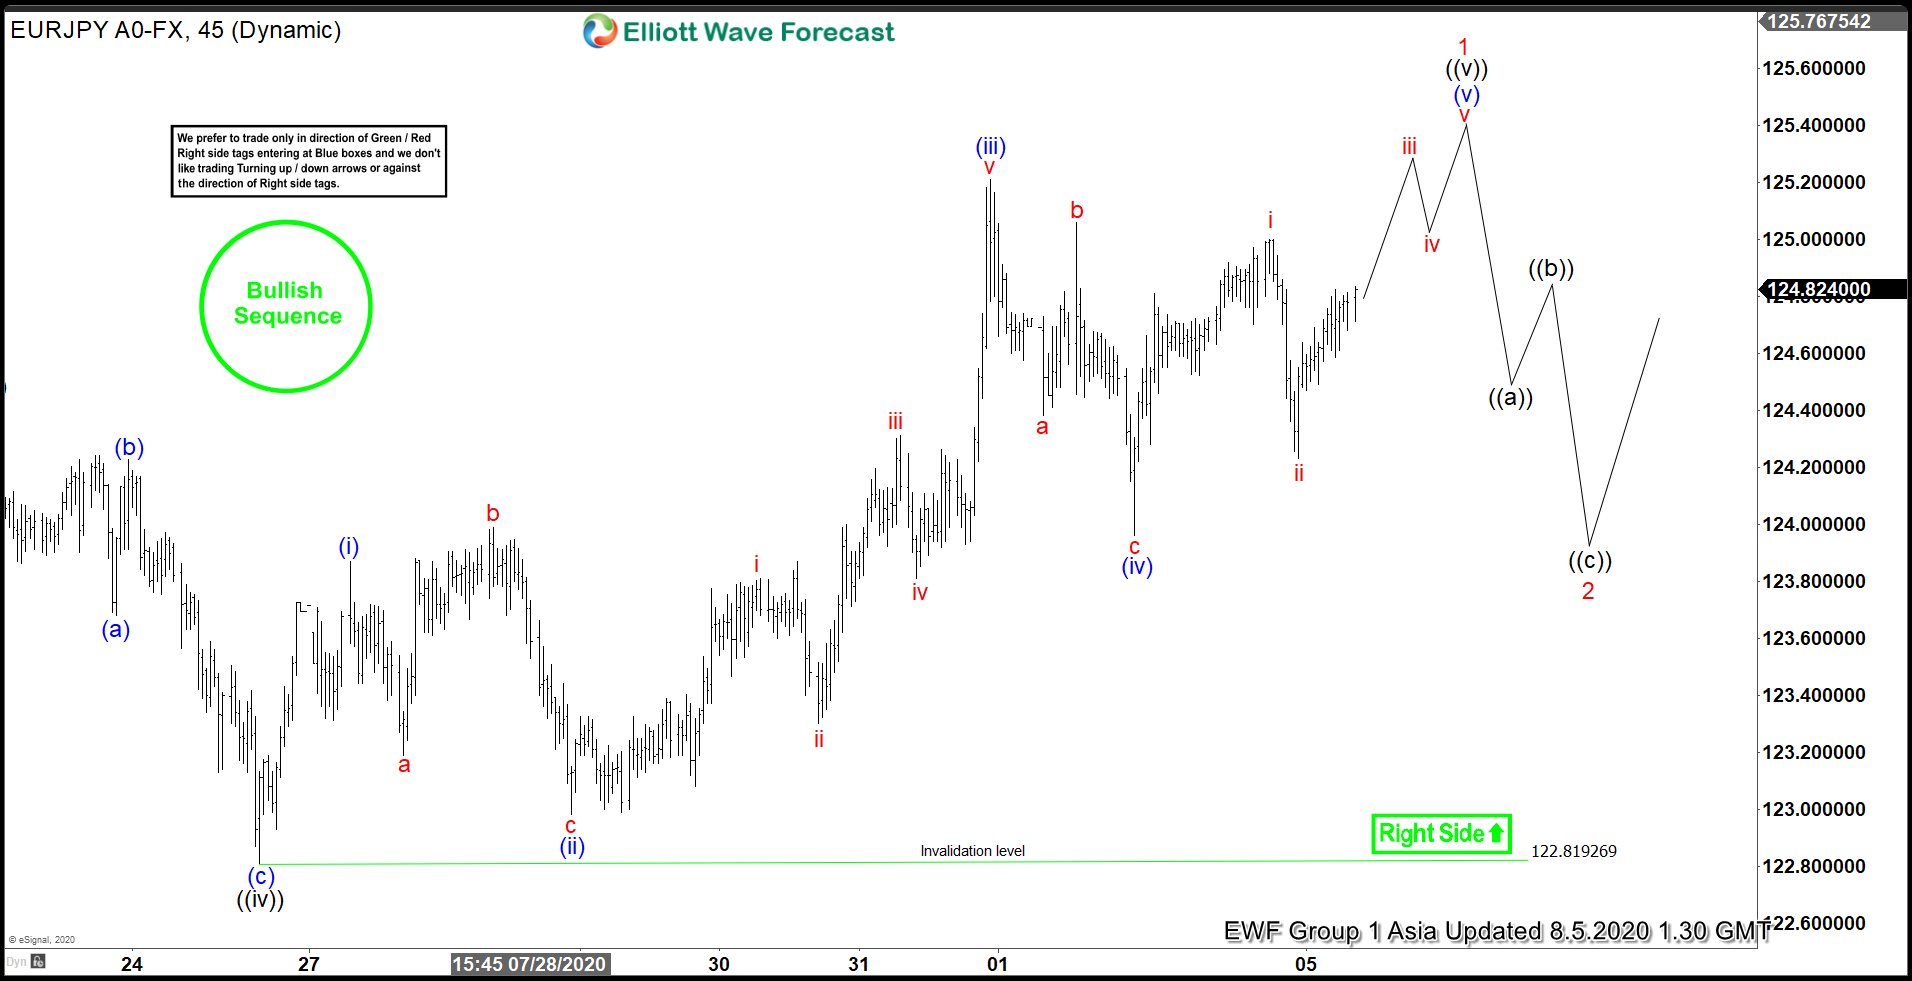
EURJPY 45 Minutes chart below shows that the pair has ended the cycle from July 22 high in wave ((iv)) at 122.81 low. Up from wave ((iv)) low, the pair extended higher in wave (i), which ended at 123.87 high. The pullback in wave (ii) then ended at 122.98 low. The correction unfolded as a Flat Elliott Wave Structure. Afterwards, the pair resumed higher in wave (iii), which ended at 125.20 high. The subdivision of wave (iii) unfolded as a 5 waves impulsive Elliott Wave Structure. Wave (iv) pullback then ended at 123.96 low. Currently, wave (v) is in progress. It needs to break above wave (iii) high to confirm the next leg higher has already started. While above 122.81 low, the pair can still see a few more highs before ending a larger degree wave 1. Afterwards, it should pullback in wave 2 to correct cycle from June 22 low before the rally resumes again.
The recent rally in EURJPY has broken above June 5 high. The pair is now showing a bullish sequence against May 6 low. The 100-123.6% extension where the rally can potentially end is between 129.24-131.61 area. As long as June 22 low at 119.12 stays intact, expect the dips in 3,7 or 11 swings to find support for more upside in the near term targeting the equal leg area.
EURJPY 45 Minutes Elliott Wave Chart