
Hello fellow traders. In this technical blog we’re going to take a quick look at the Elliott Wave charts of CHFJPY , published in members area of the website. As our members know, we’ve been calling rally in CHFJPY within the cycle from the May low. The pair made pull back that has unfolded as Elliott Wave Zig Zag pattern ((a))((b))((c)). In the further text we are going to explain the Elliott Wave Pattern and the Forecast.
Before we take a look at the real market example, let’s explain Elliott Wave Zigzag pattern.
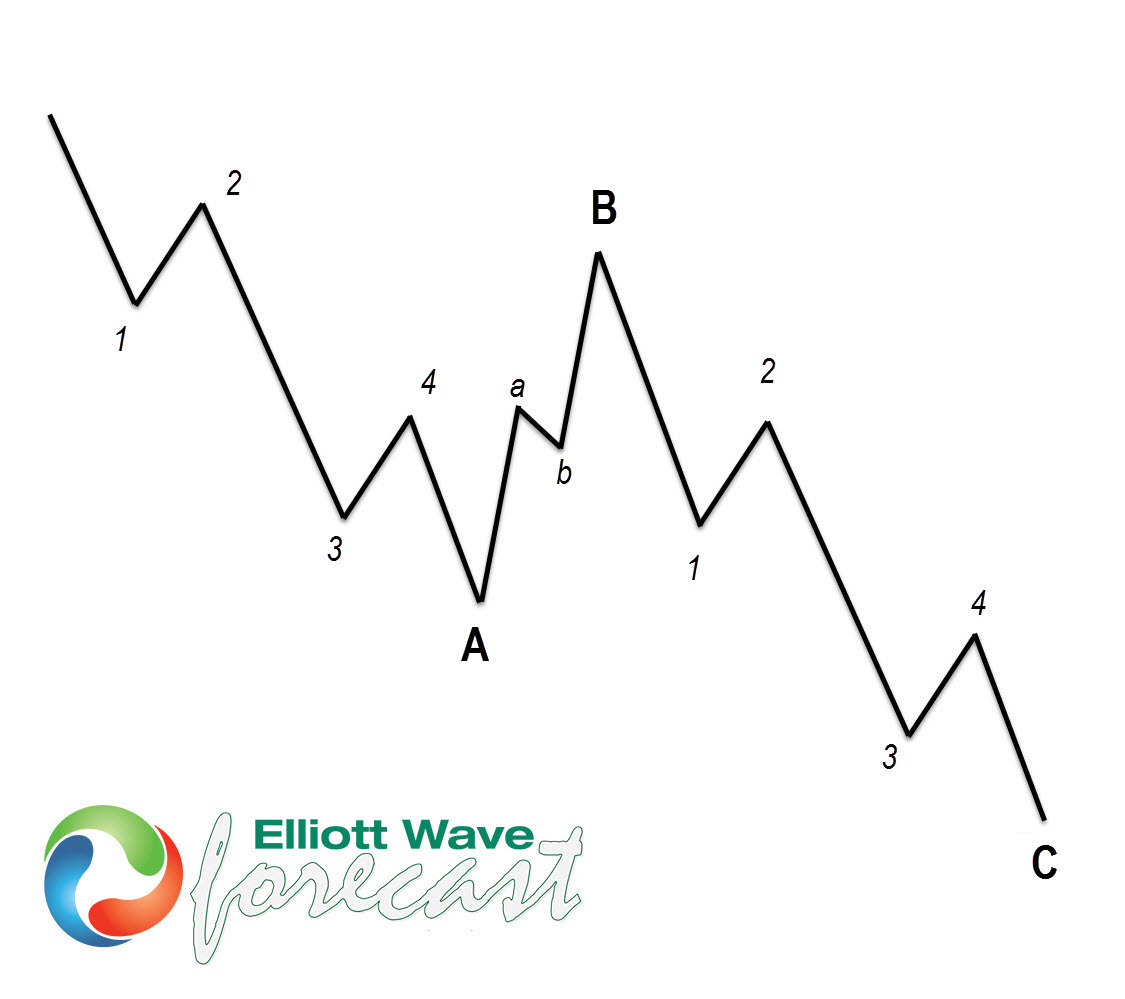
Elliott Wave Zigzag is the most popular corrective pattern in Elliott Wave theory . It’s made of 3 swings which have 5-3-5 inner structure. Inner swings are labeled as A,B,C where A =5 waves, B=3 waves and C=5 waves. That means A and C can be either impulsive waves or diagonals. (Leading Diagonal in case of wave A or Ending in case of wave C) . Waves A and C must meet all conditions of being 5 wave structure, such as: having RSI divergency between wave subdivisions, ideal Fibonacci extensions and ideal retracements.
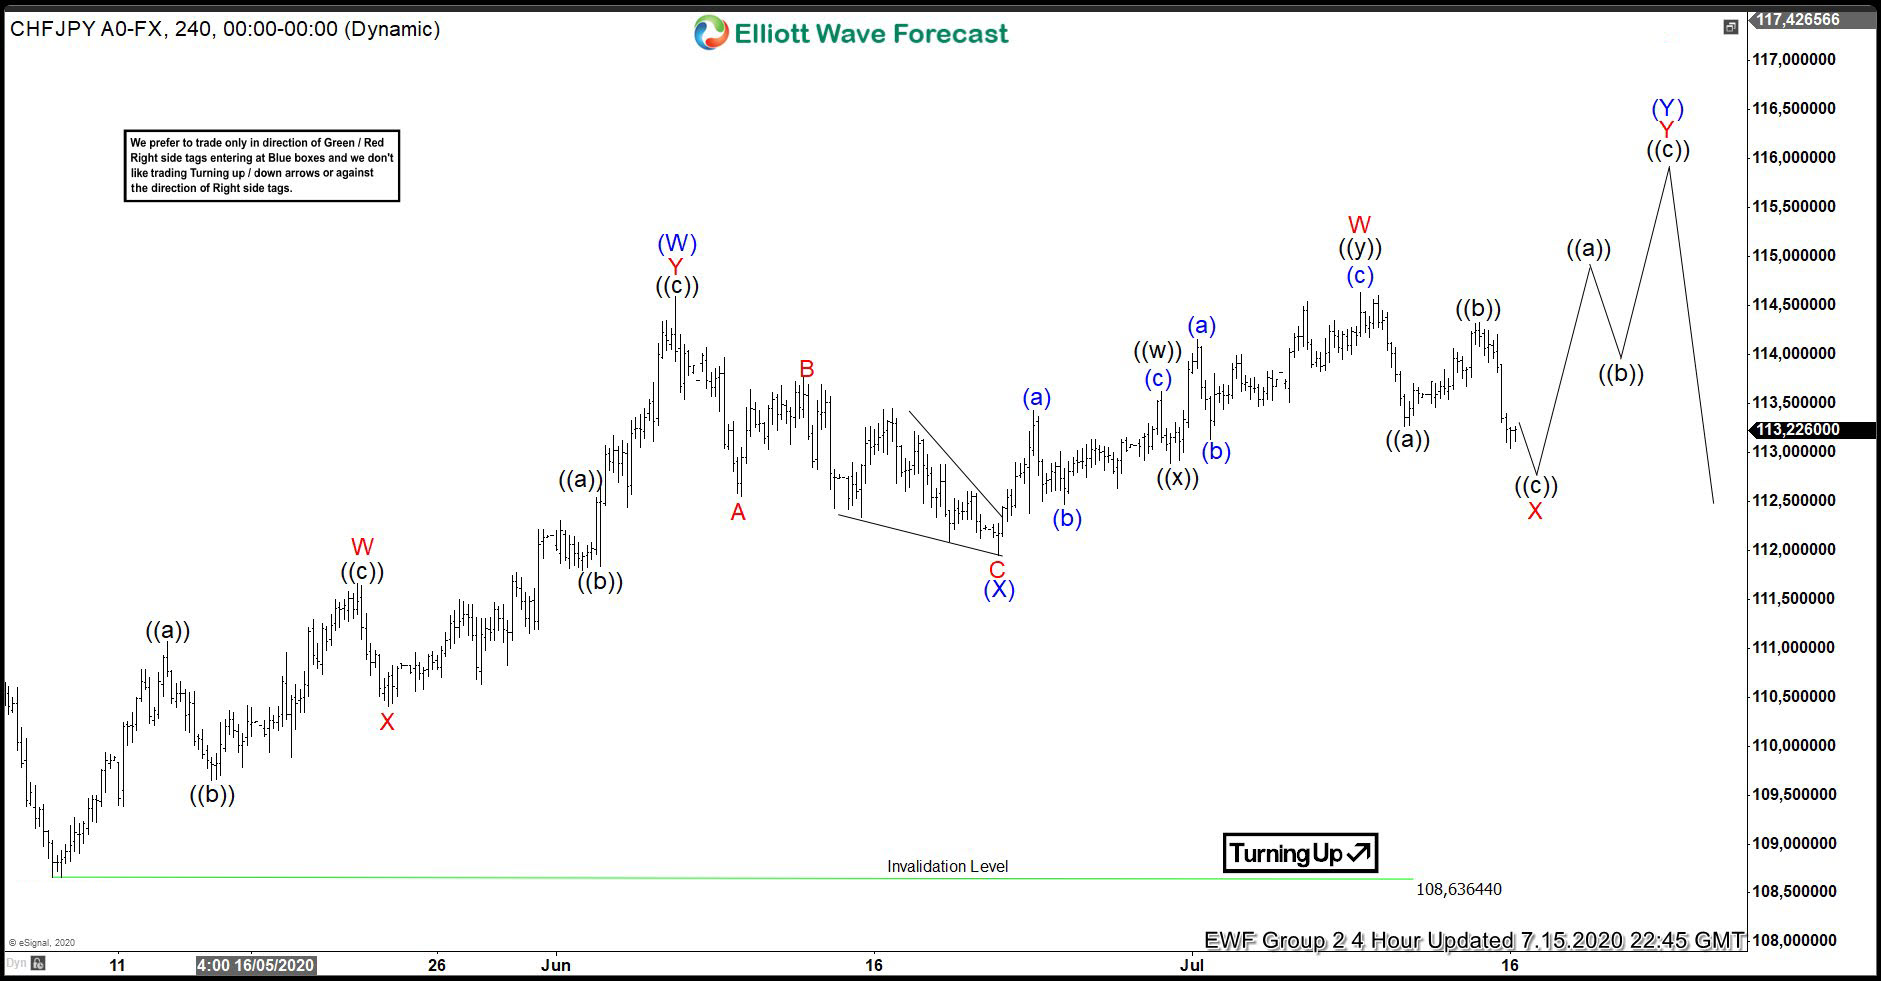
CHPFJPY 4 Hour Elliott Wave Analysis 7.15.2020
The pair is trading within the cycle from the May low. Currently we are getting Wave X red pull back back agianst the June 112 low. Correction still looks incomplete at the moment, suggesting we can get more short term weakness before rally takes place toward new highs.
Let’s take a look at the lower time frame to see what short term price structure looks like.
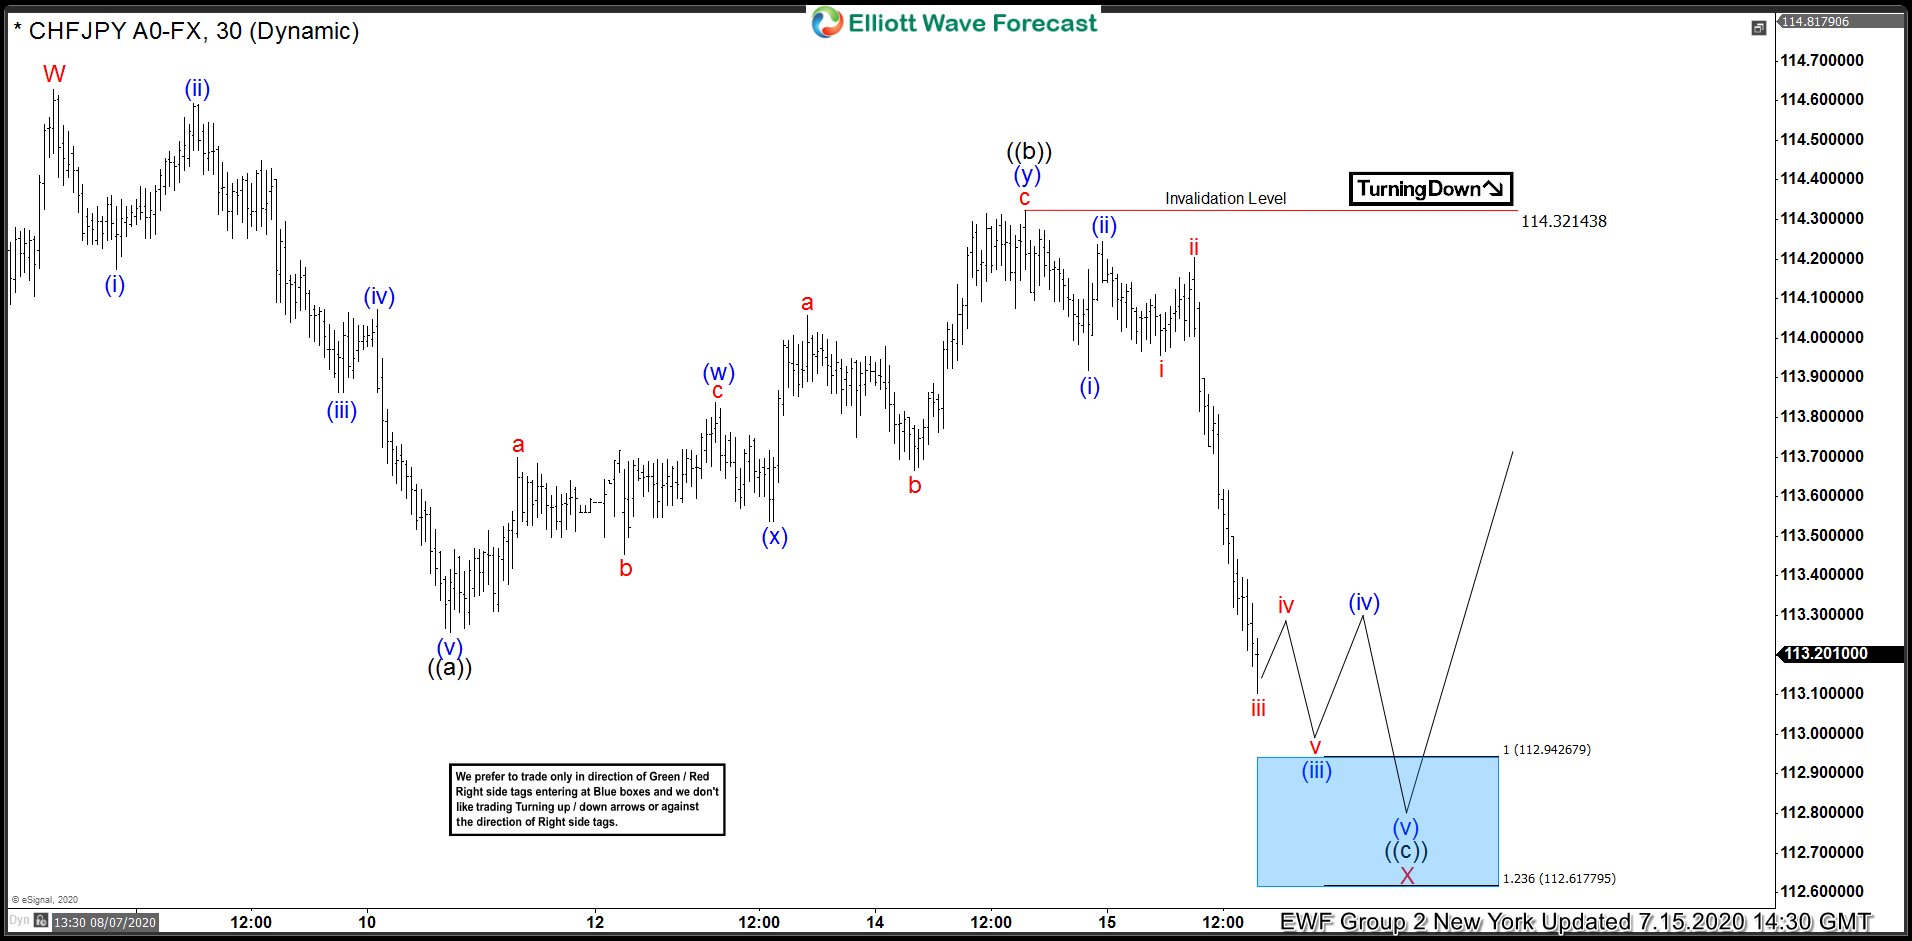
CHFJPY 1 Hour Elliott Wave Analysis 7.15.2020
The pair is doing wave X red pull back that is unfolding as Elliott Wave Zig Zag pattern. First leg ((a)) black unfolded as 5 waves down from the peak. Then we got 3 wave bounces in wave ((b)) and finally, we’re doing last leg down ((c)) black. Pull back looks incomplete at the moment. We expect to see 5 waves down n ((c)) leg , ideally toward 112.94-112.61 area. We don’t recommend selling the commodity and expect buyers to appear soon for further rally toward new highs.
You can learn more about Zig Zag Elliott Wave Patterns at our Free Elliott Wave Educational Web Page.
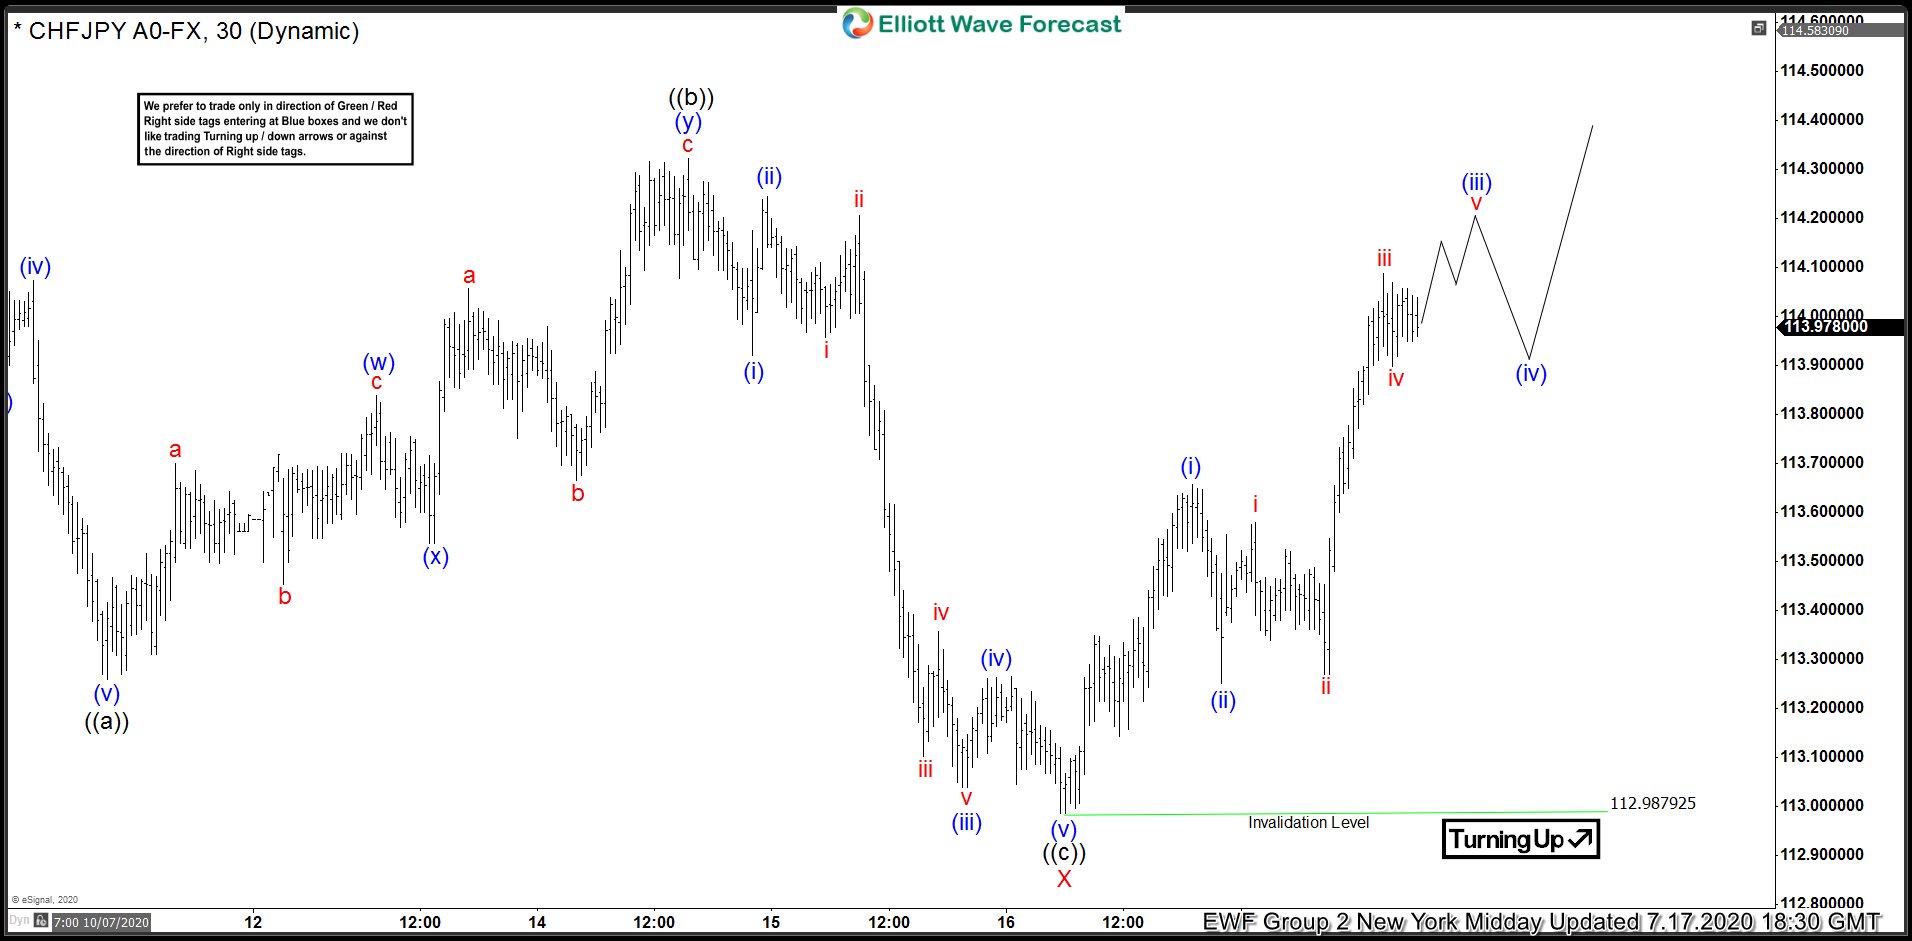
CHFJPY 1 Hour Elliott Wave Analysis 7.17.2020
Eventually we got 5 waves down in wave ((c)) as expected. However, the price missed to reach 112.94 area and pull back completed early at 112.987. The pair needs to see break above 06/05 peak in order to confirm next leg up is in progress. Anyway we don’t recommend selling the pair in any proposed pull back and expect it to keep finding buyers in 3,7,11 swings.
Keep in mind market is dynamic and presented view could have changed in the mean time. You can check most recent charts in the membership area of the site. Best instruments to trade are those having incomplete bullish or bearish swings sequences.We put them in Sequence Report and best among them are shown in the Live Trading Room
Elliott Wave Forecast