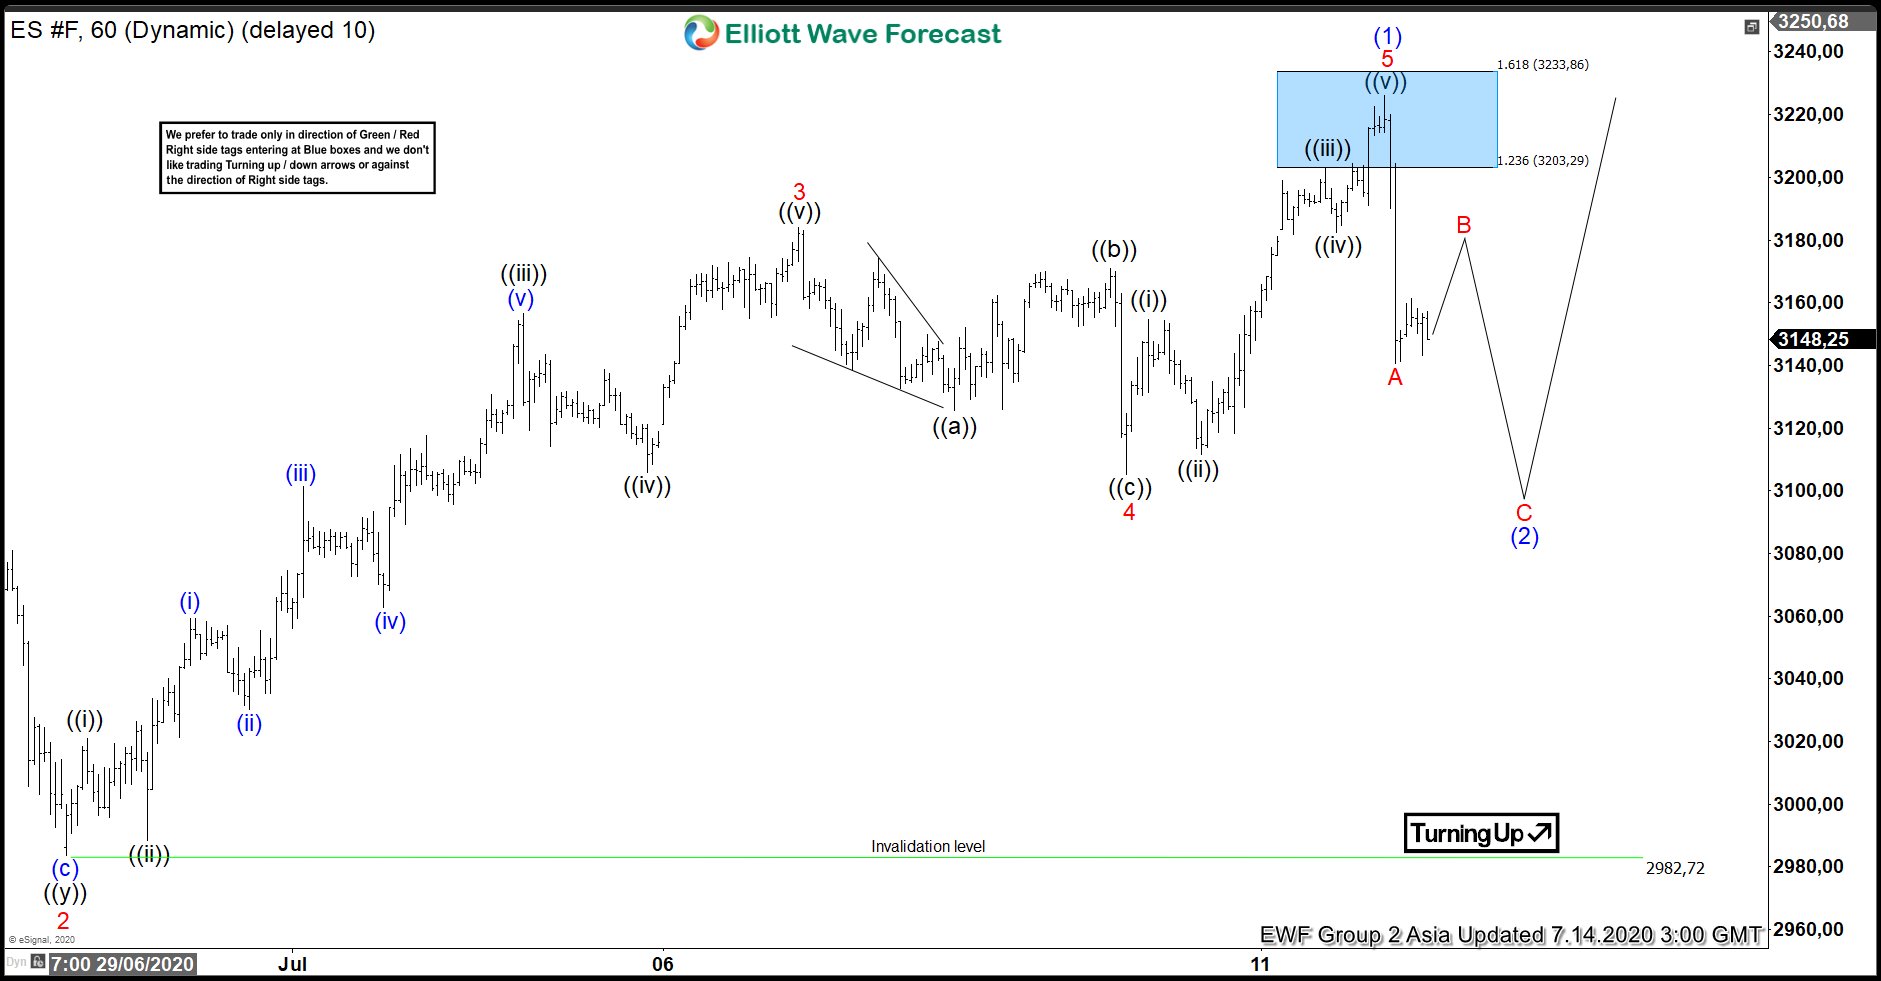
Elliott Wave View in S&P 500 E-mini Futures (ES_F) suggests the rally from 6.15.2020 low has ended at 3226.25 high as wave (1). Up from 6.15.2020 low, wave 1 ended at 3156.25 high and wave 2 dips ended at 2982.72 low. Index then extended higher in wave 3 towards 3184 high. The internal subdivision of wave 3 unfolded as 5 waves impulse Elliott Wave Structure. Wave ((i)) of 3 ended at 3021 high and wave ((ii)) pullback ended at 2988.50 low. Rally higher in wave ((iii)) then ended at 3156.50 high, followed by wave ((iv)) pullback which ended at 3105.75. Wave ((v)) then extended higher and ended at 3184 high.
Wave 4 pullback then unfolded as a zig-zag Elliott Wave structure and ended at 3105.25 low. Finally, wave 5 higher ended at 3226.25 high. This final move completed wave (1) in higher degree and ended cycle from 6.15.2020 low. Index is currently correcting that cycle within wave (2). The correction is unfolding as a zigzag structure where wave A ended at 3190 low. Currently, wave B remains in progress and will be followed by another leg lower in wave C. While pullback stays above 2982.72 low, expect the dips in 3,7 or 11 swings to find support for more upside.
ES_F 1 Hour Elliott Wave Chart