
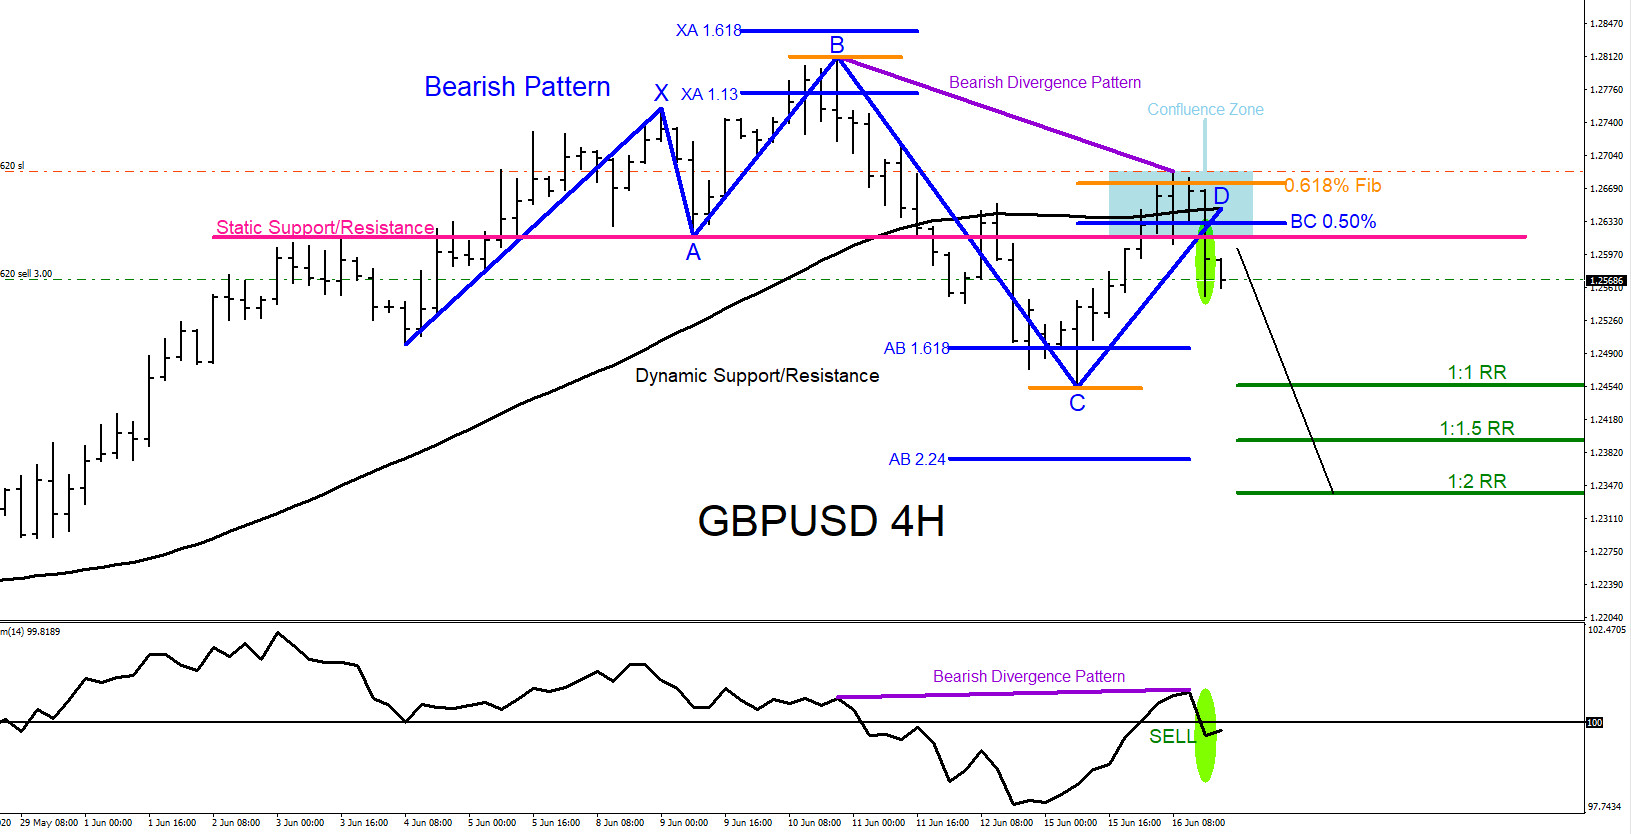
On June 16 2020 I posted on social media Stocktwits/Twitter @AidanFX “GBPUSD watching for SELLS”.
The chart below was also posted on social media StockTwits/Twitter @AidanFX June 16 2020 showing that a bearish market pattern (blue) formed which then triggered the pair to react with a move lower. A bearish divergence pattern (purple) also formed and was clearly visible which also signalled for the move lower. Dynamic (black) and static (pink) resistance plus the 0.618% Fib. level (orange) also added to the reaction lower from the blue box confluence zone. Momentum indicator crossed below the 100 level confirming the SELL and for momentum to continue lower. I called for traders to SELL GBPUSD and only a move above the confluence zone would invalidate the SELL trade setup. Stop loss was set above the confluence zone targeting the green 1:1 RR and 1:2 RR targets.
GBPUSD 4 Hour Chart 6.16.2020
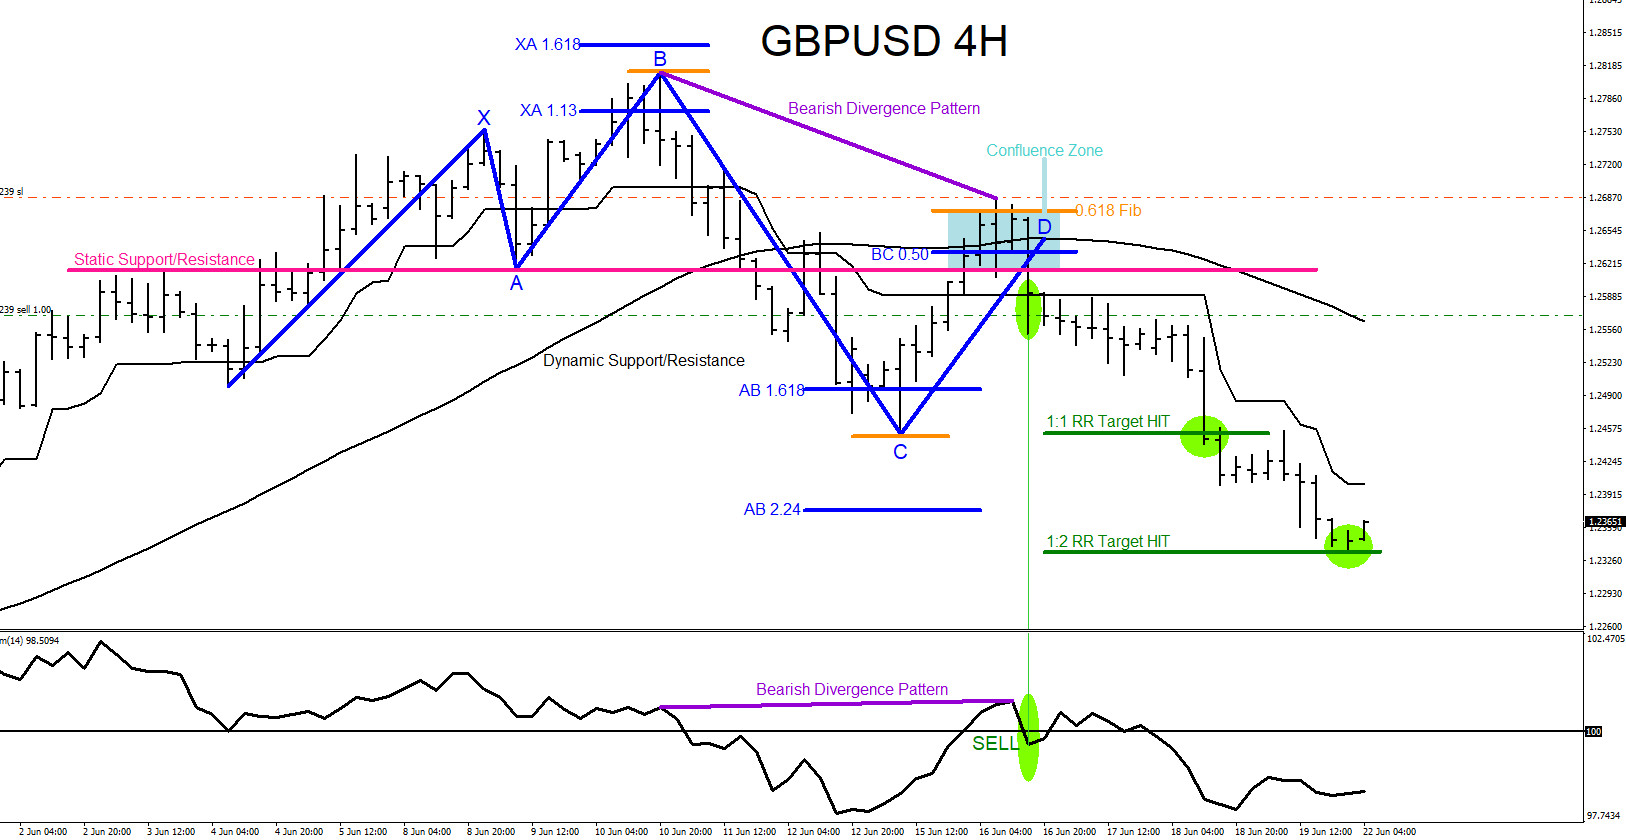
GBPUSD continues lower the rest of the trading week and on June 21 2020, the start of the new trading week, price reaches the 1:2 RR target at 1.2335 from 1.2570 entry for +235 pips. If you followed me on Twitter/Stocktwits @AidanFX you too could have caught the GBPUSD move lower.
GBPUSD 4 Hour Chart 6.21.2020
Of course, like any strategy/technique, there will be times when the strategy/technique fails so proper money/risk management should always be used on every trade. Hope you enjoyed this article and follow me on Twitter for updates and questions> @AidanFX or chat me on Skype > EWF Aidan Chan