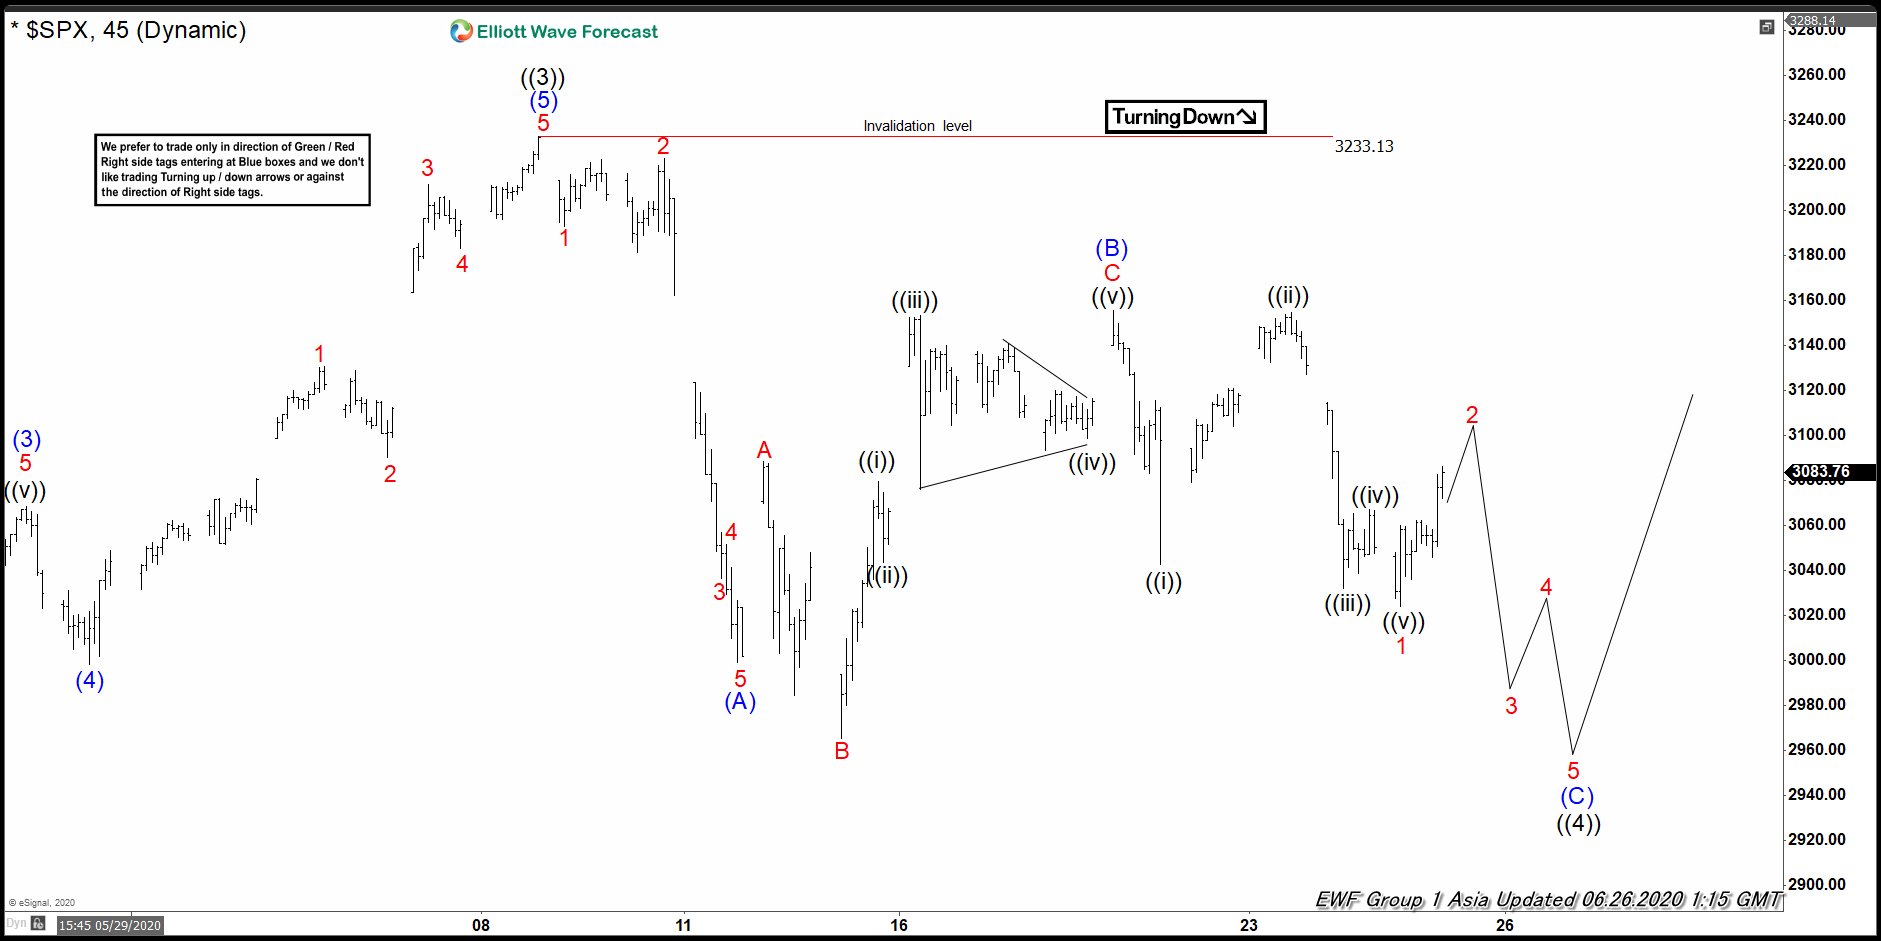
Elliott Wave View in SPX suggests the rally from 4.2.2020 low ended at 3233.13 high as 5 waves impulse Elliott Wave Structure. Up from 4.2.2020 low, wave (1) ended at 2954.86 high and wave (2) dips ended at 2766.64 low. Index then extended higher in wave (3) towards 3068.67 high and wave (4) pullback ended at 2998.61 low. Finally wave (5) higher ended at 3233.13 high. This final move completed wave ((3)) in higher degree and ended cycle from 4.2.2020 low.
Index is currently correcting that cycle within wave ((4)). The decline is unfolding as a zigzag structure where wave (A) ended at 2999.49 low. Internal of wave (A) unfolded as 5 waves where wave 1 ended at 3193.11 low, wave 2 ended at 3223.27 high, wave 3 ended at 3036.52 low, wave 4 ended at 3056.86 high, and wave 5 ended at 2999.49 low. Afterwards, bounce in wave (B) ended at 3155.53 high. Wave (B) took the form of a flat where wave A ended at 3088.42 high, wave B ended at 2965.66 low, and wave C ended at 3155.53 high.
Currently, wave (C) remains in progress. Down from wave (B) high, wave 1 ended at 3024.01 low. Near term, wave 2 bounce is in progress. While bounce stays below 3233.13 high, expect the Index to extend lower to complete wave (C). Potential target lower is 100% – 123.6% Fibonacci extension of (A)-(B) which comes at 2866-2921 area.
SPX 45 Minutes Elliott Wave Chart