
The GPBUSD pair last week formed a temporary top and reversed lower. Towards the end of the trading week GBPUSD made lower lows and lower highs signalling the pair was in a downside trend. Traders use confluence zones to catch possible trade setups. Confluence zones are when 2 or more trading techniques/strategies come together and form a high probability BUY/SELL zone. Traders can spot confluence zones on any time frame. The charts below will show visible signals calling for the GBPUSD pair to push lower.
GBPUSD 1 Hour Chart June 12 2020
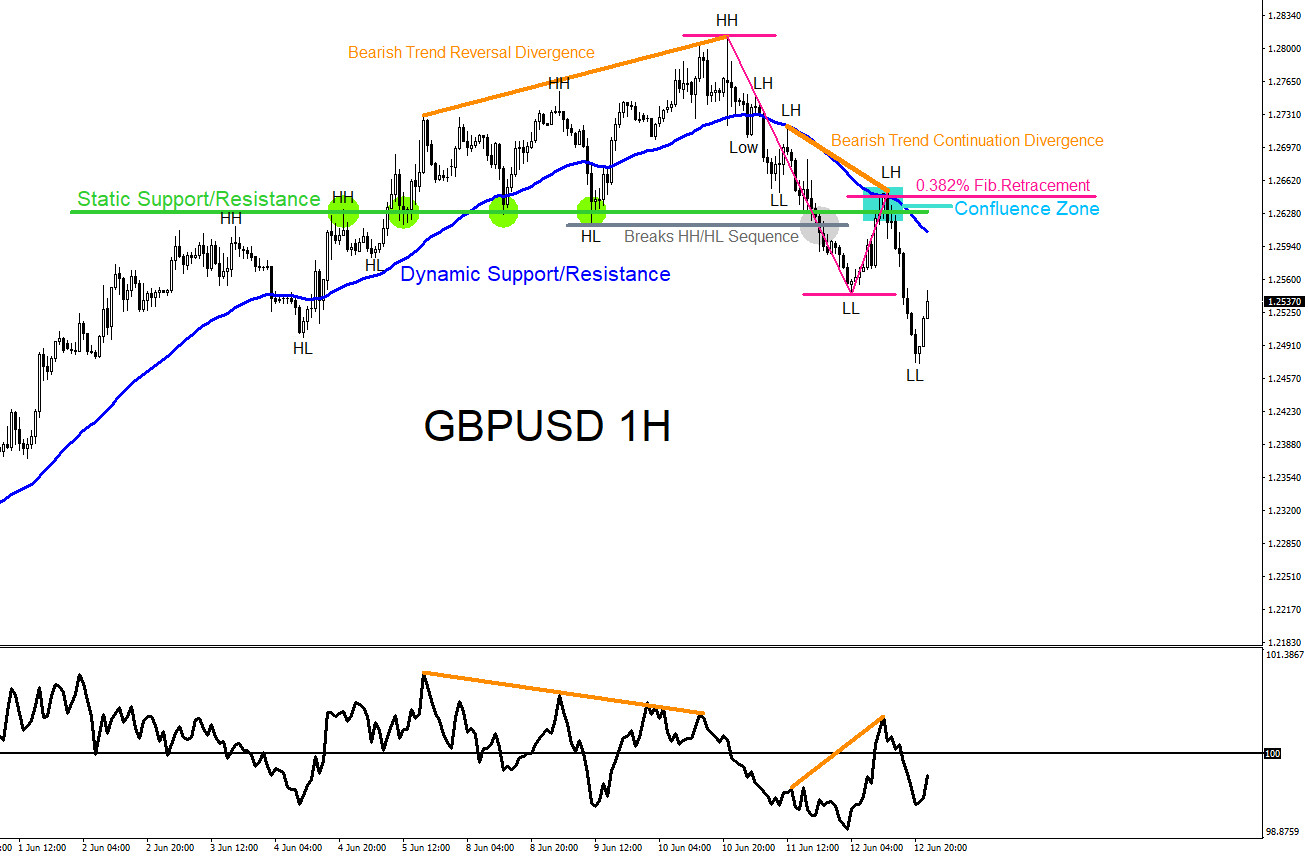
On the 1 hour chart a bearish trend reversal divergence pattern (orange) formed. Price reacted with a move lower June 10 2020 which then started a lower low lower high sequence. Price also broke the higher high higher low sequence which added more confirmation for a trader to look for more downside price action. The confluence zone was spotted when price hit the static support/resistance level (green), the 50 moving average dynamic support/resistance (blue) and the 0.382% Fib retracement level (pink) which all converged in the same area. A bearish trend continuation divergence pattern (orange) also formed in the same area which added more confidence the pair would push lower. When a high probability trade setup is spotted a trader should switch to a smaller time frame to time the entry.
GBPUSD 15 Minute Chart June 12 2020
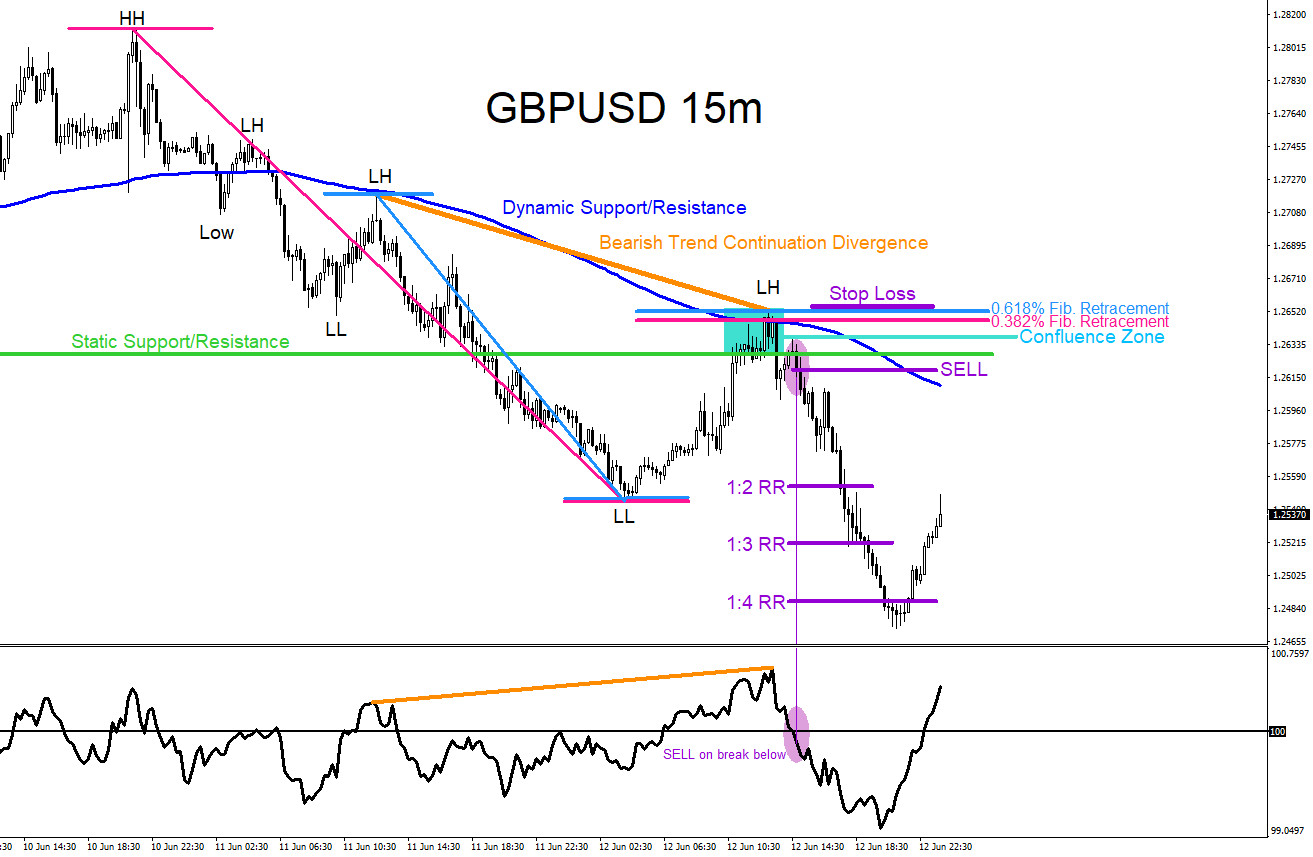
When scaling down to the 15 minute time frame the chart also showed a similar confluence zone. The static resistance level (green), 200 moving average dynamic resistance (blue), and a Fibonacci cluster 0.382% Fib. retracement level (pink) and 0.618% Fib. retracement level (light blue) formed the confluence zone. A bearish trend continuation divergence pattern (orange) was also visible on the 15 minute time frame in the same confluence zone. SELL trade was triggered when the momentum indicator broke below the 100 level with stops above the most recent high. GBPUSD pushed lower and hit the 1:4 RR target.
Of course, like any strategy/technique, there will be times when the strategy or technique fails so proper money risk management should always be used on every trade. Hope you enjoyed this article and follow me on Twitter for updates and questions> @AidanFX or chat me on Skype > EWF Aidan Chan