Fortinet Inc (NASDAQ: FTNT) ended it’s initial bullish cycle from 2009 low after it rallied within an impulsive 5 waves advance which reached a pea at $121.8 peak on February of this year. The multinational corporation gained a total of %1330 during this 11 Years rally putting it on the list of one of the fastest growing stocks in last decade.
FTNT saw a 40% drop this year following the broad market correction before a strong reversal taking place in March allowing the stock to return positive with +27% YTD after breaking again to new all time highs.
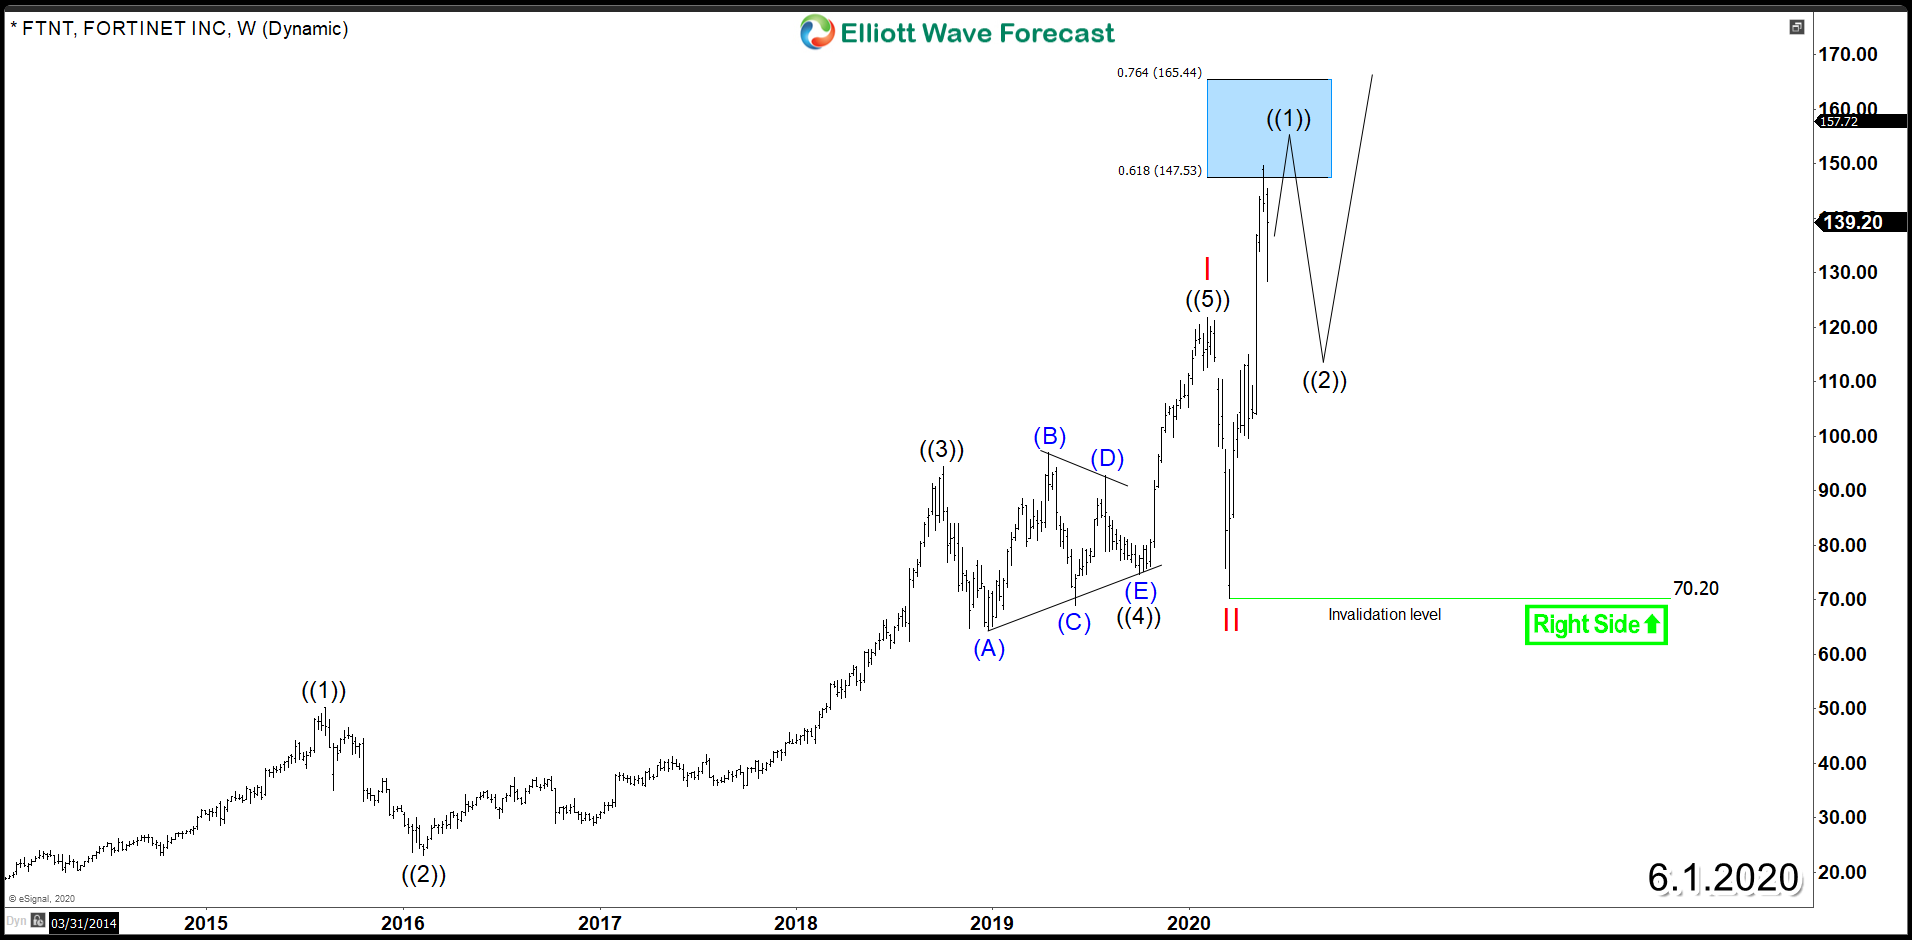
The recent move allowed the stock to create a new bullish sequence from IPO supporting a new impulsive 5 waves move toward 100% – 161.8% Fibonacci extension area $194 – $270. The first leg of the new cycle reached the initial target area $147 – $165 from where wave ((1)) is expected to end this summer followed by a corrective pullback in wave ((2)) against March low $70.20 then it can resume the rally again.
Fortinet Weekly cycle remains bullish as the overall trend is intact with an impulsive structure supporting the stock into new highs and the next pullback will provide a good investment opportunity in 3 , 7 or 11 swings.
Fortinet FTNT Weekly Chart