Hello fellow traders. In this technical blog we’re going to take a quick look at the Elliott Wave charts of DAX . As our members know DAX has recently given us pull back against the March 8239.5 low that has unfolded as Elliott Wave Zig Zag Pattern. We were calling cycle from the March low completed and decline in 3 waves toward Blue Box (buyers zone). In the further text we are going to explain the Elliott Wave Pattern and the Forecast.
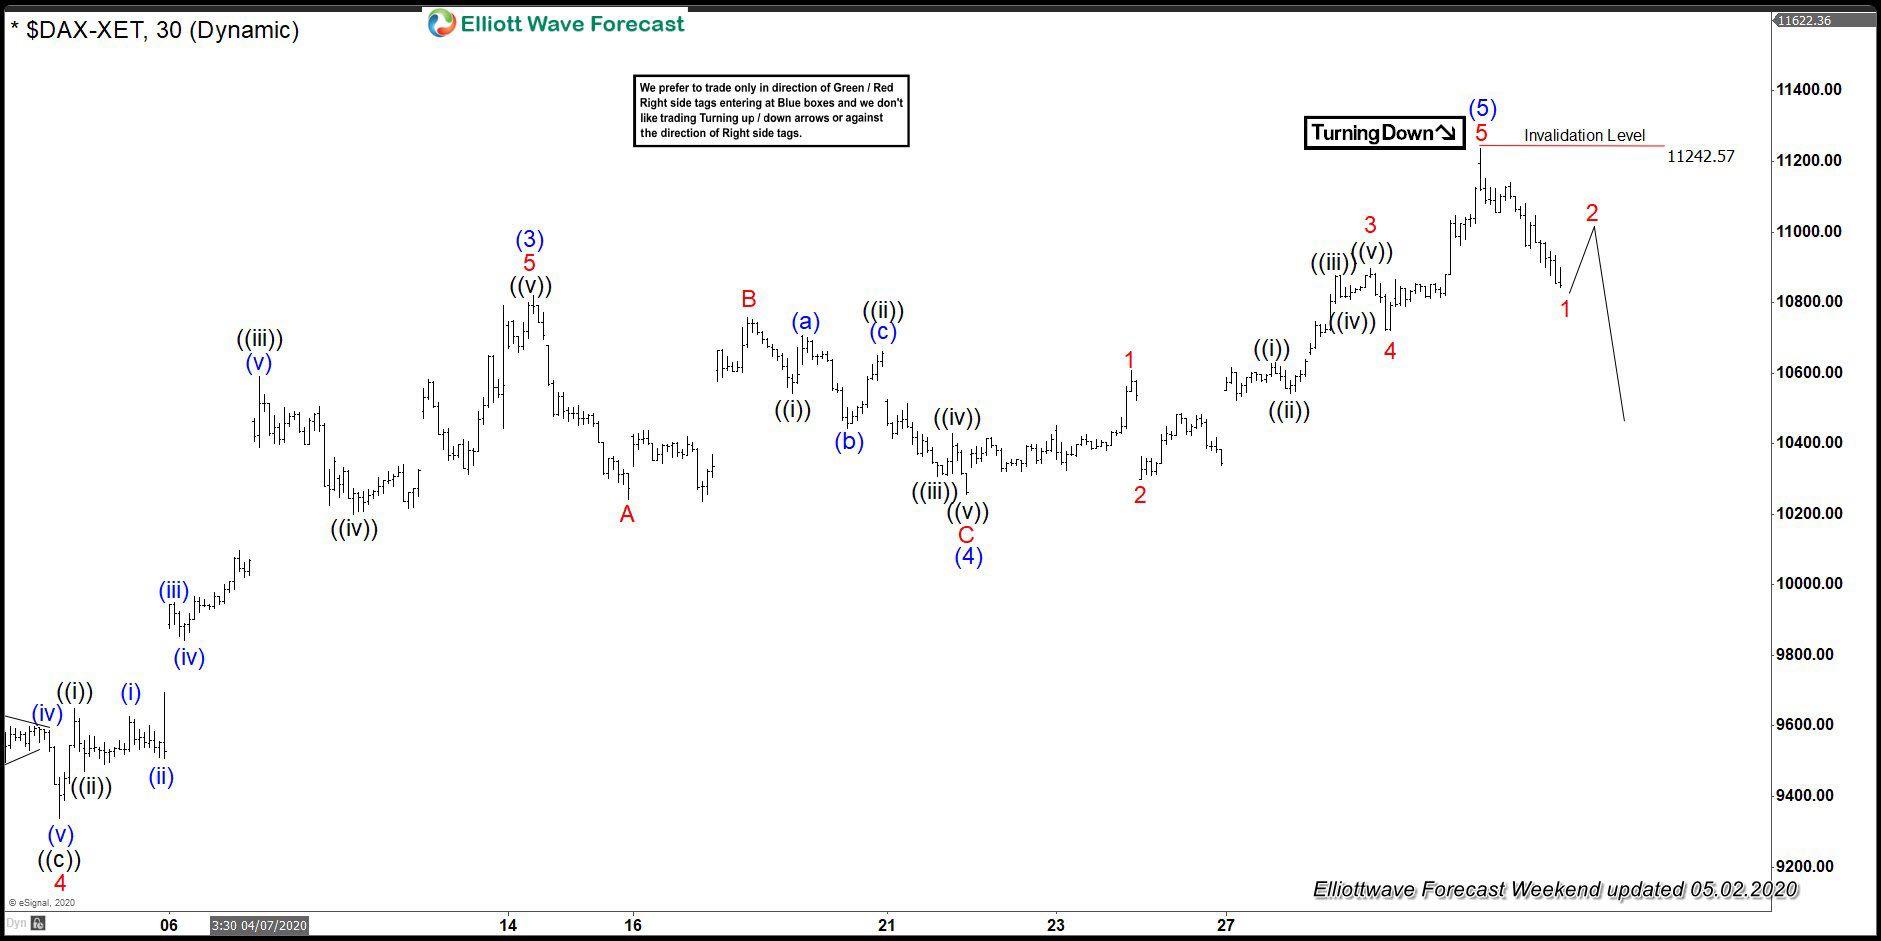
DAX 1 Hour Elliott Wave Analysis 5.2.2020
Current view suggests March cycle can be completed at the 11242.57 peak as 5 waves rally. As far as the price stays below mentioned high, pull back against the 8239.5 low can be in progress. The price needs to see further separation from the mentioned peak to give us confirmation we are getting pull back against the March 8239.5 low.
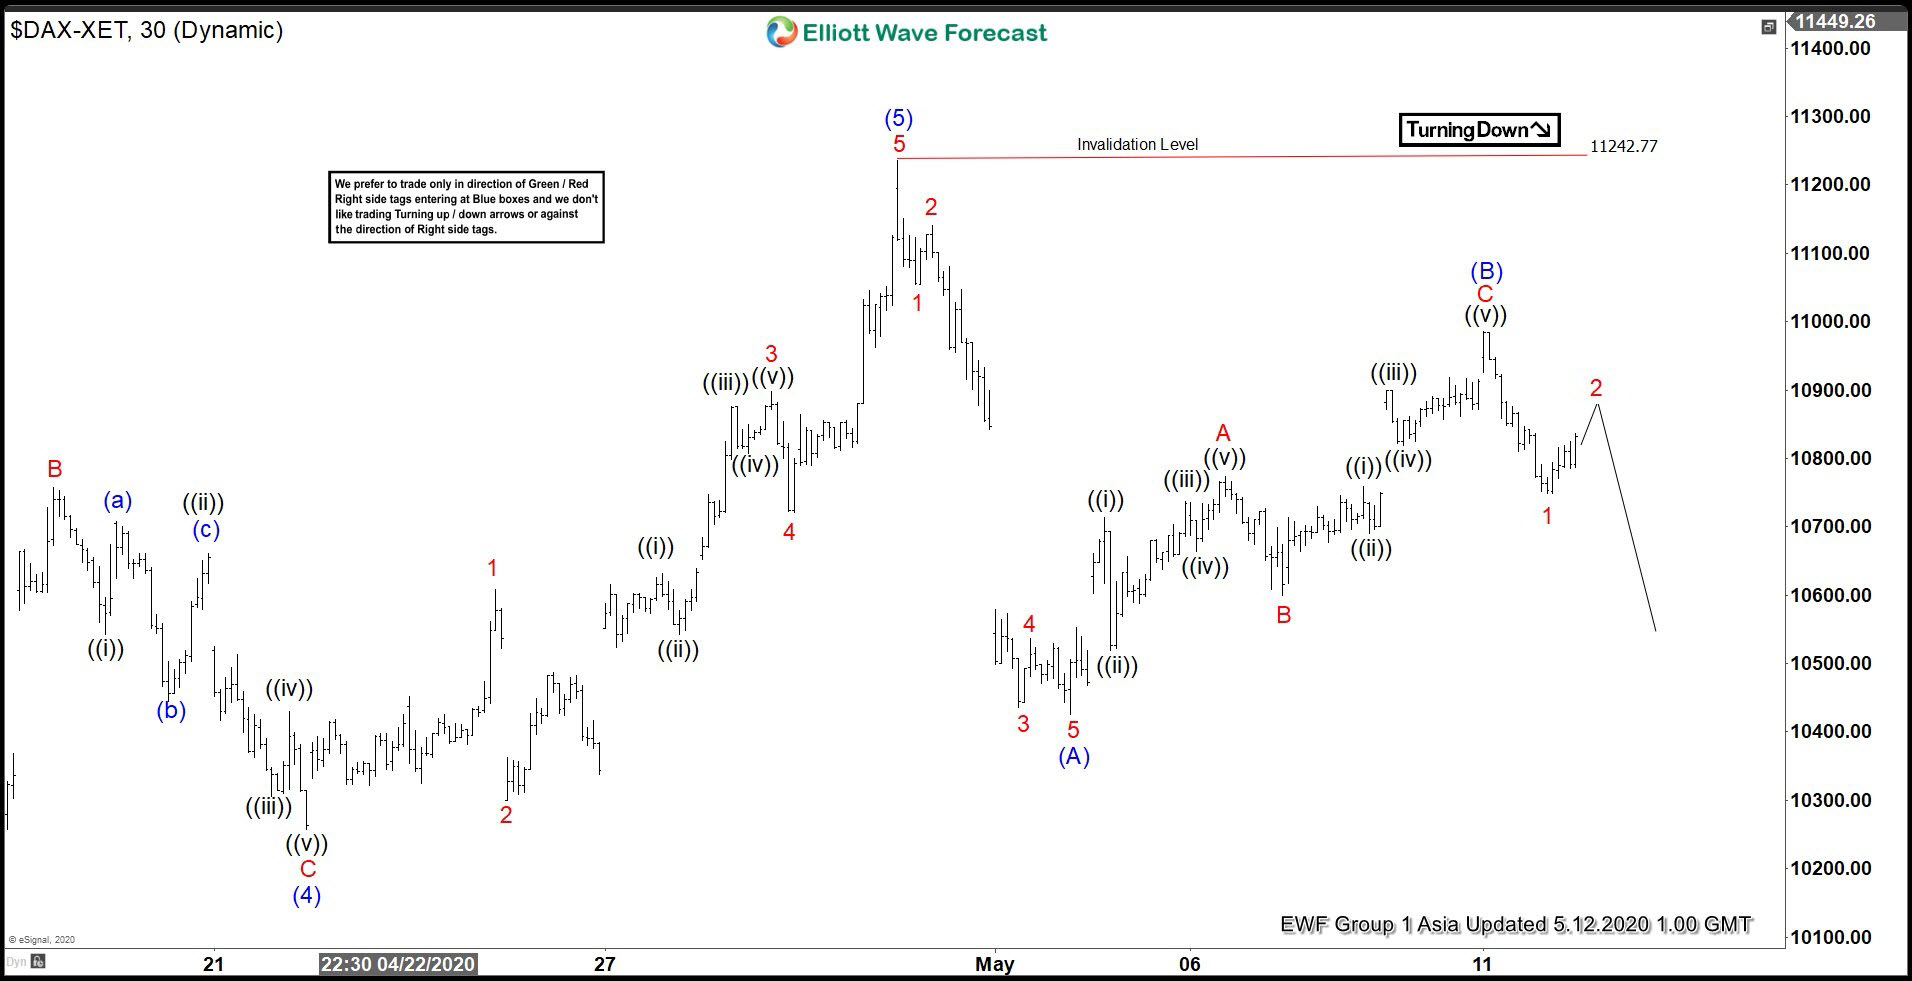
DAX 1 Hour Elliott Wave Analysis 5.12.2020
We got 5 waves down from the 11252.77 peak which we assume it’s only the first leg of the pull back that is unfolding as a Zig Zag Pattern. After 5 waves down, we got 3 waves bounce in (B) blue that has completed at 10988.39 high. As far as the price stays below (B) blue peak, we should be ideally doing last leg down (C) blue. Pull back looks incomplete at the moment. We expect more weakness toward new lows, to complete 5 waves in (C) blue leg of Zig Zag Pattern.
You can learn more about Zig Zag Elliott Wave Patterns at our Free Elliott Wave Educational Web Page.
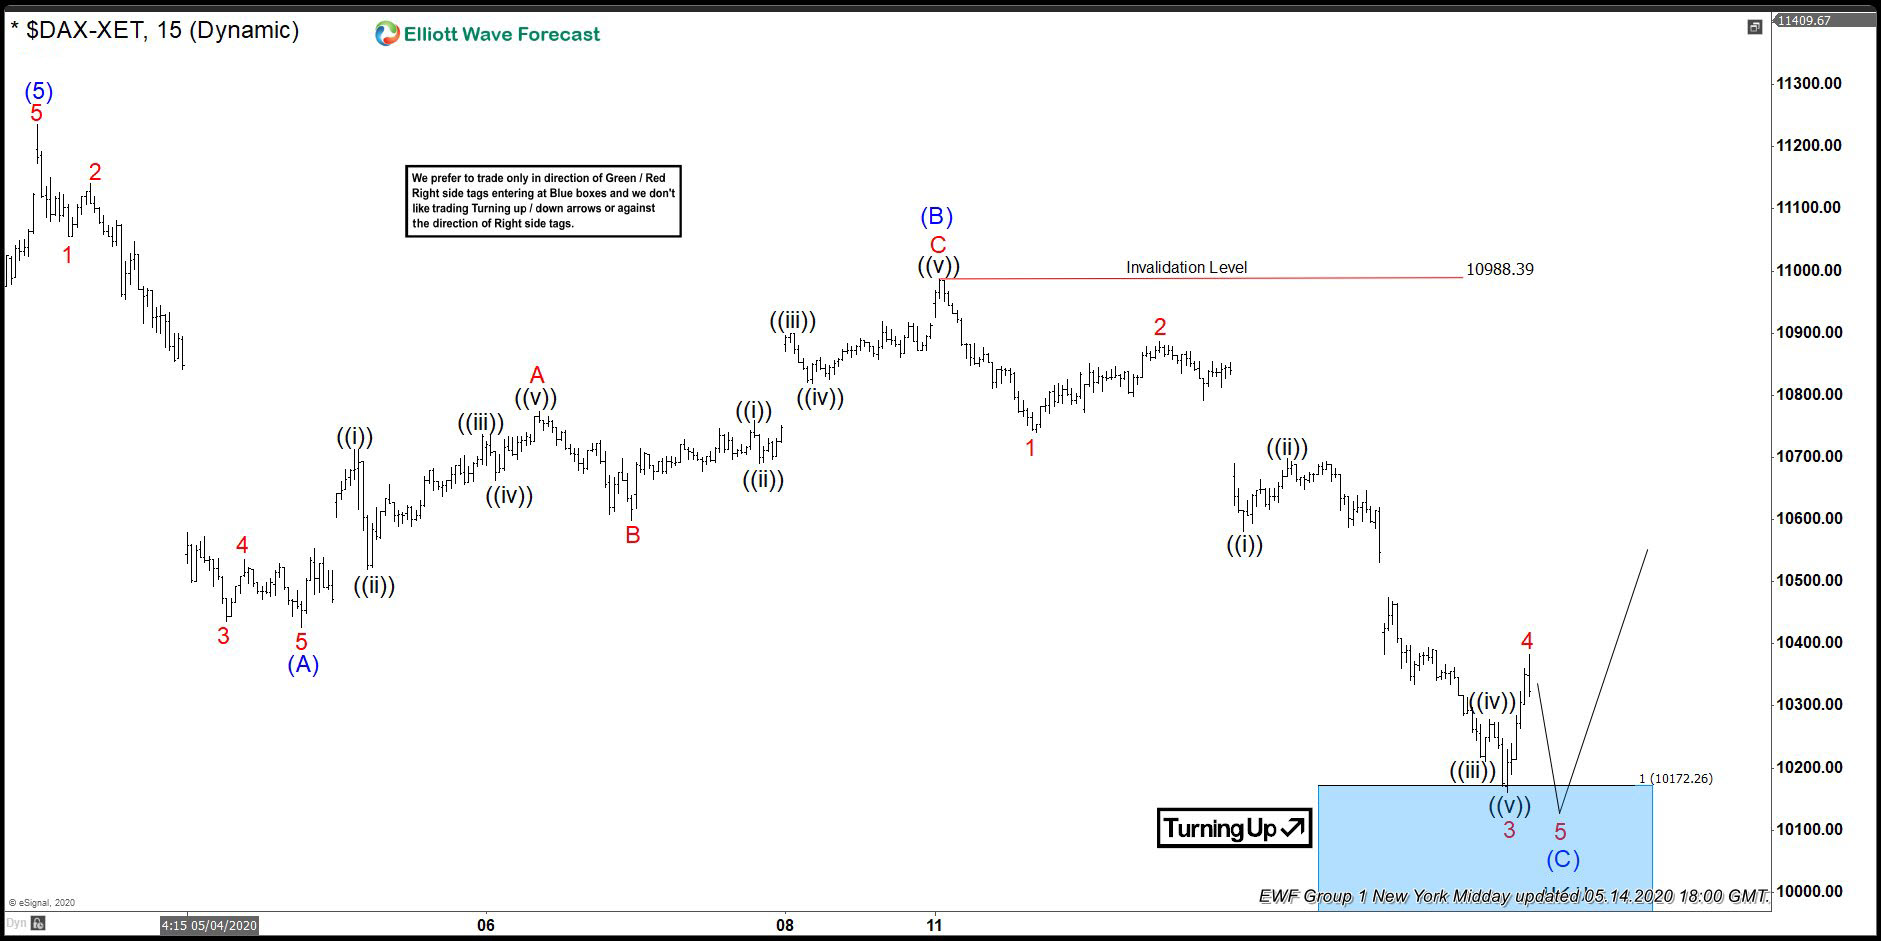
DAX 1 Hour Elliott Wave Analysis 5.14.2020
10988.39 high has held nicely and we got decline. The price has reached equal legs (A)-(B) at 10172.26-9983.8. At the marked Blue Box area area we expect buyers to appear for further rally toward new highs ideally . As our members know Blue Boxes are no enemy areas , giving us 85% chance to get a bounce.
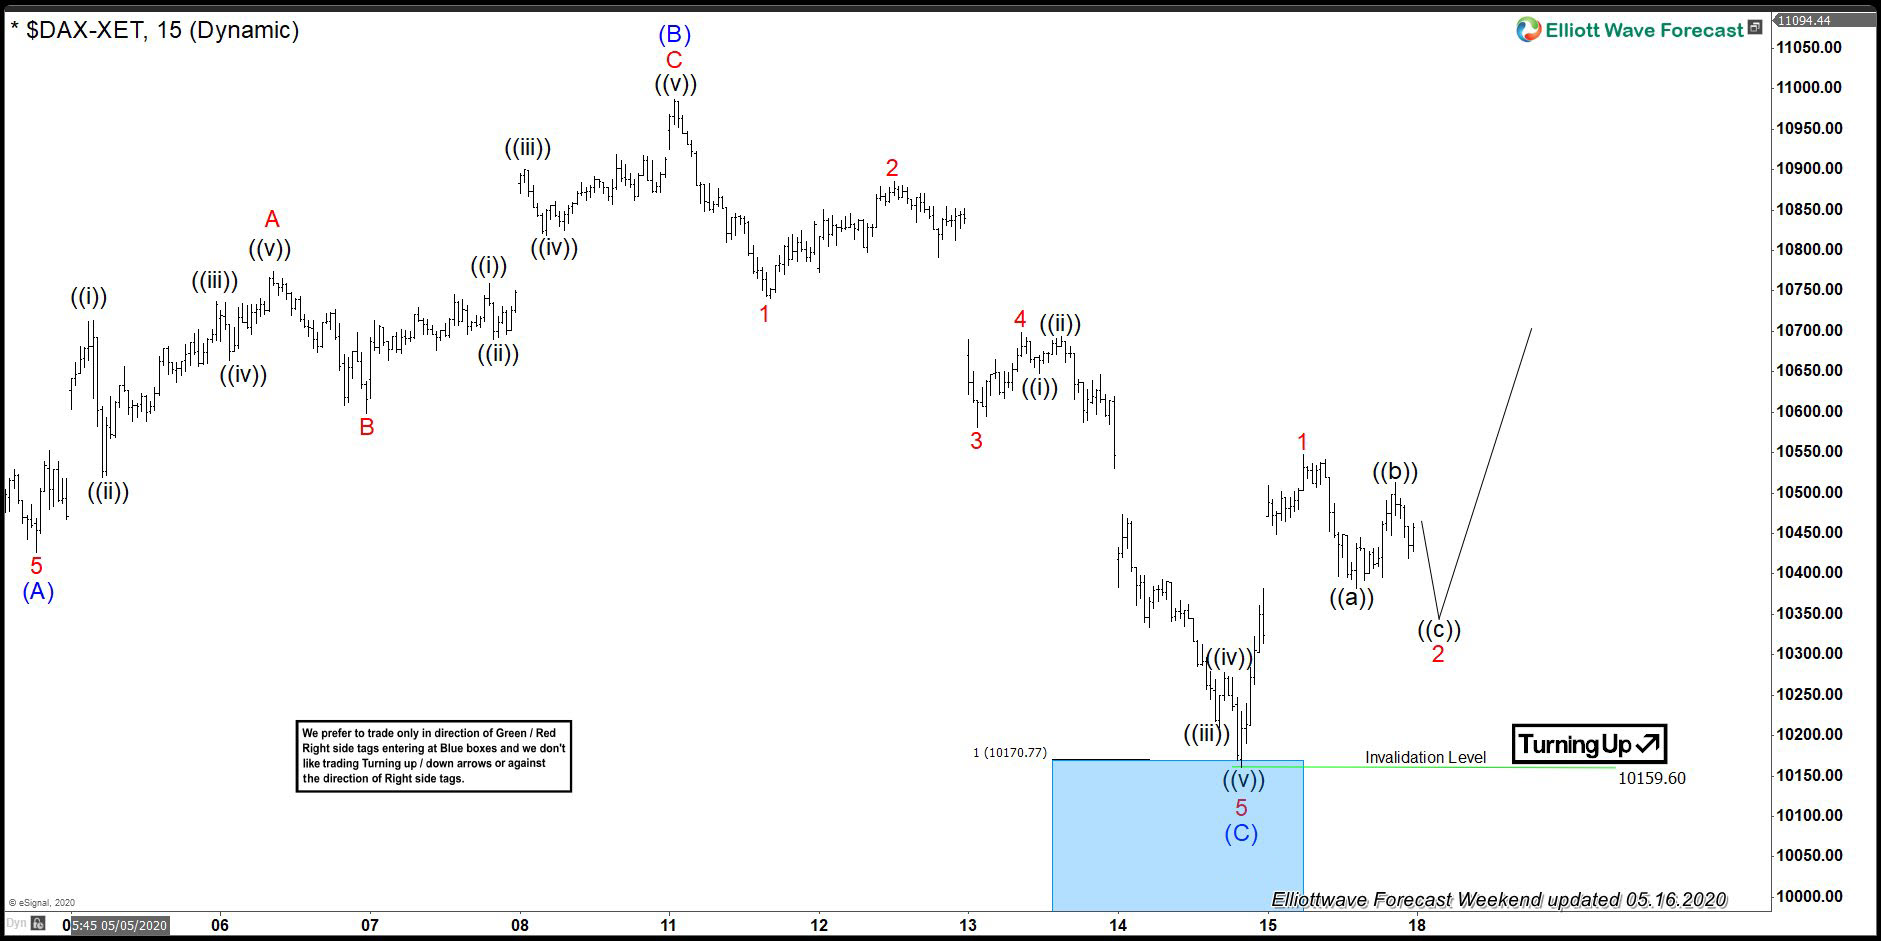
DAX 1 Hour Elliott Wave Analysis 5.16.2020
DAX found buyers right at the equal legs (A)-(B) at 10172.26. Elliott Wave Zig Zag pattern ended at the 10159.6 low. Short term bounce looks impulsive so we counted it as wave 1 of the new bullish cycle. We would need to see further separation from the 10159.6 low and ideally break above 04/30 peak to get confirmation next leg up is in progress according to higher time frames.
Keep in mind market is dynamic and presented view could have changed in the mean time. You can check most recent charts in the membership area of the site. Best instruments to trade are those having incomplete bullish or bearish swings sequences.We put them in Sequence Report and best among them are shown in the Live Trading Room
Elliott Wave Forecast