
In this article, we will take a look at Southwest Airline (ticker: LUV) stock. The airlines industry and stock have been battered due to the corona virus. We do understand that the Fundamentals might not look great right now for the airlines industry. However, fundamentals can change in an hour, and anticipating the move is what matters at the end.
At EWF, we forecast the market using a combination of technical tools like the Elliott Wave Theory, distribution, RSI, cycles, sequences, and market correlations. We do understand not every trader looks at the market the same way. Many traders use fundamental analysis as the primary tool of trading, which is ok, as far as it works. We always forecast and trade the same way.
To avoid subjective interpretation, we do not like to present alternate views in our charts. We believe in the idea that a trader’s best chance to succeed is to have a system and apply it over and over again with the same criteria. Southwest Airlines’ price action is well defined and fits the requirements of a popular Elliott wave structure. An Ending Diagonal appears most of the time in a wave five and follows these guidelines:
- It appears as subdivision of wave 5 in an impulse or wave C in a zigzag
- Ending diagonal usually shows overlapping waves 1 and 4 and has shape like a wedge. The overlap between wave 1 and 4 is not a condition, however.
- The subdivision of an ending diagonal is 3-3-3-3-3.
The following chart is a representation of an ending diagonal:

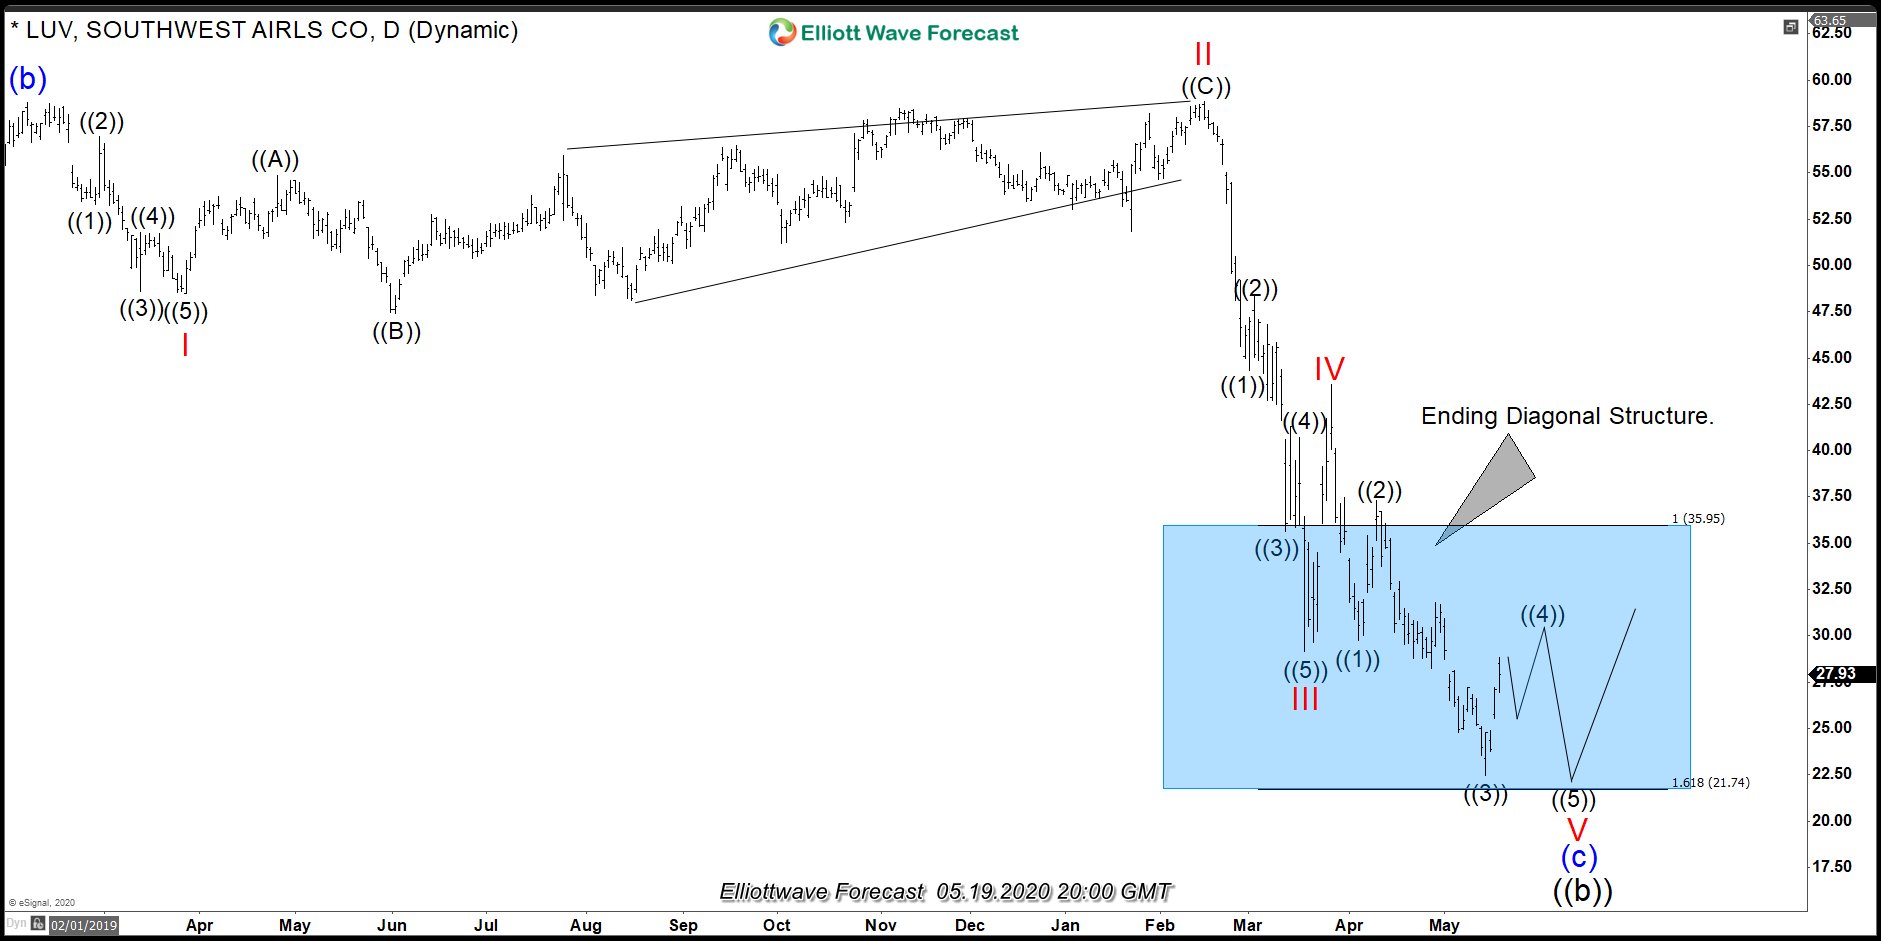
We look at the following two charts from $LUV. One chart is in the daily time frame and the other is in 4 hour time frame. We can see how the instrument in the daily time frame seems to create an overlapping structure with lack of momentum. This fits very well with the criteria of an ending diagonal. Right now. we believe a wave ((3) in black degree ends at the low. Wave ((4)) bounce can be underway with 1 more push lower in wave ((5)).
However, a a huge low could have been formed as well, even when it is too early to tell. The confirmation that the final low is in place will be a break of the downtrend line or a break above wave ((2)) peak. The stock is now trading within a blue box, which is the inflection area where a turn can happen anytime. Reaching the blue box with an ending diagonal structure is enough information for us not to sell and to start looking for opportunity to buy.
Southwest Airlines (LUV) Daily Elliott Wave Chart
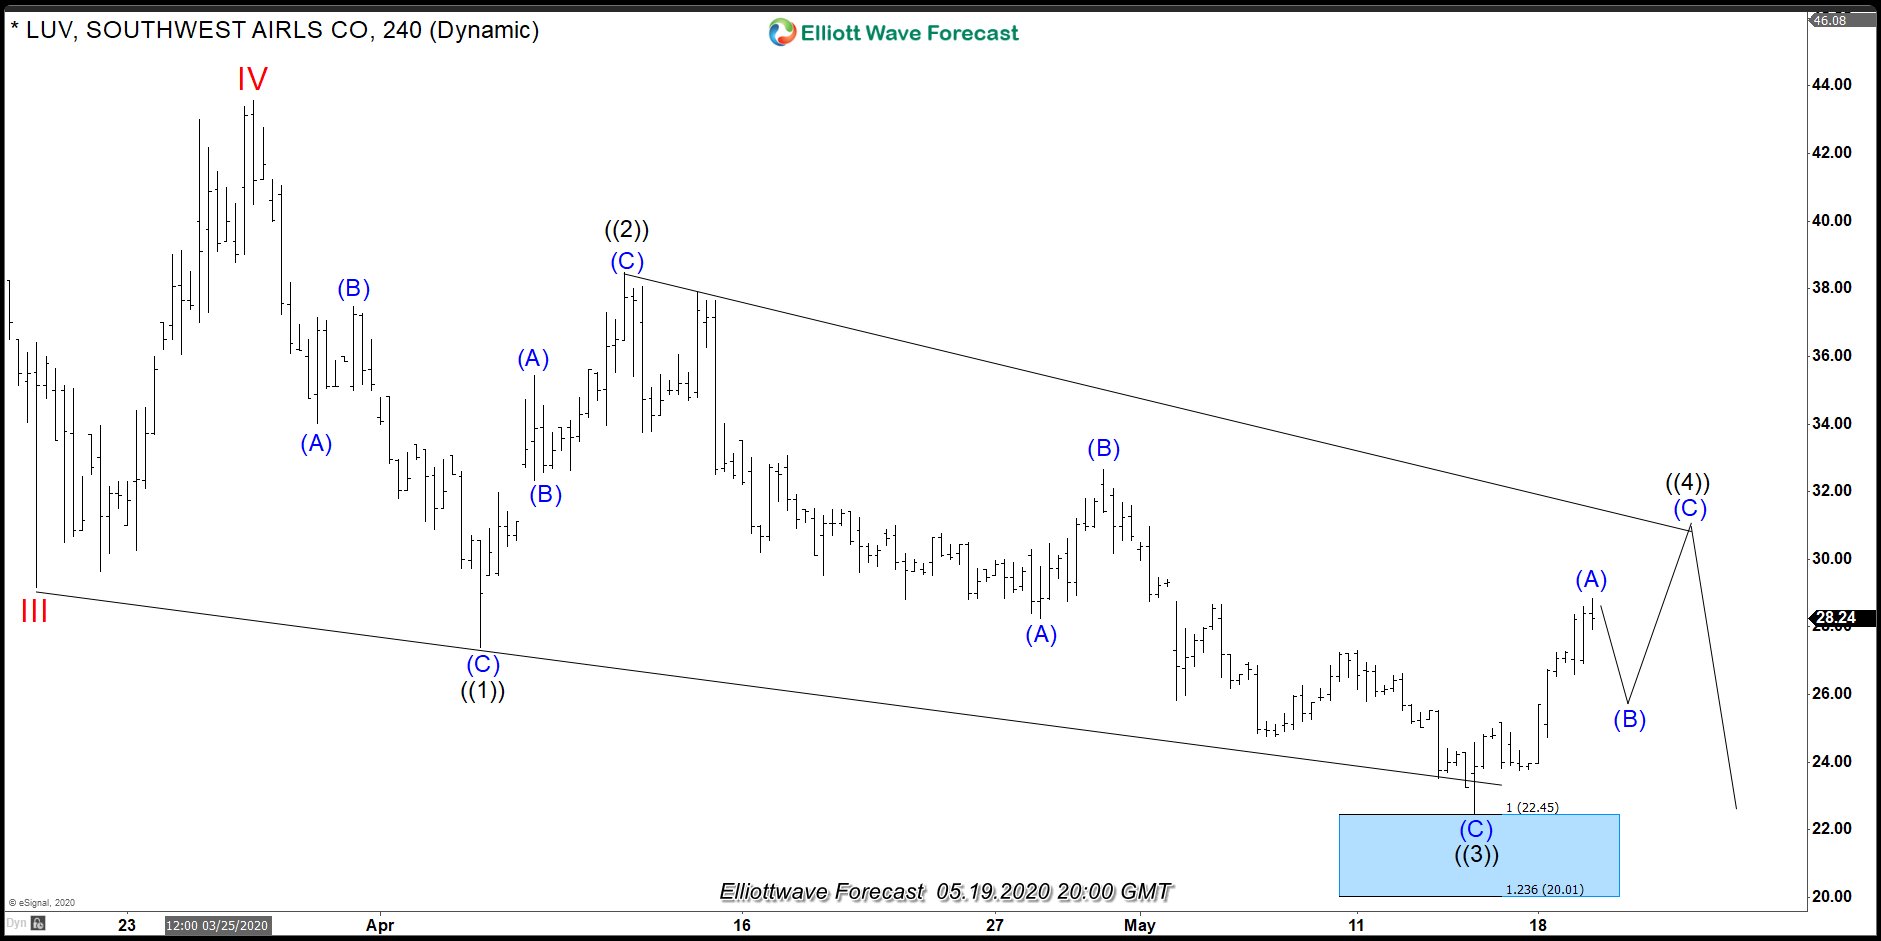
Downgrading the time frame, we look at the 4 Hour view below. We can see how the Instrument reacted higher from the blue box area. We can even count the ending diagonal completed. However, we want to wait for wave ((2)) peak to be broken before calling the low in place. The reaction of the lows from wave ((3)) seem to be impulsive. This leads us to believe after three waves pullback, more upside should take place within wave ((4)).
Southwest Airlines (LUV) 4 hour Elliott Wave Chart
In Conclusion, Southwest Airlines i close to turning higher. When the turn higher happens, a robust rally will take place. Secondly, World Indices will trade higher when this turn happens. After all, it is one market only. Thirdly, by looking at the Daily chart and structure and levels of South West Airlines. it is hard to see another leg lower than the one from 02.20.2020. Consequently, a significant low can be in place. Let’s see what the future brings, but it is clear, we are here for the rally.