
Divergence trading patterns can signal traders of possible trade setups. There are 2 types of divergence patterns, regular divergence and hidden divergence. Both patterns can signal a trader on which side to trade the market. A divergence pattern is when price is moving in one direction but the oscillator indicator is moving in a different direction.
Regular (Trend Reversal Pattern) : When price is in a uptrend making a higher high and the oscillator indicator is making a higher low this is a regular bearish divergence pattern. When price is in a downtrend making a lower low but the oscillator indicator is making a lower high this is a regular bullish divergence pattern. This pattern is a sign of a trend reversal.
Hidden (Trend Continuation Pattern) : When price is in a uptrend making a higher low and the oscillator indicator is making a lower low this is a hidden bullish divergence pattern. When price is in a downtrend making a lower high but the oscillator indicator is making a higher high this is a hidden bearish divergence pattern. This pattern is a sign of trend continuation.
Both patterns can be found during a trending sequence. A trending sequence is when the instrument is on a higher high/higher low sequence (HH/HL) for an uptrend and on a lower low/lower high sequence (LL/LH) for a downtrend.
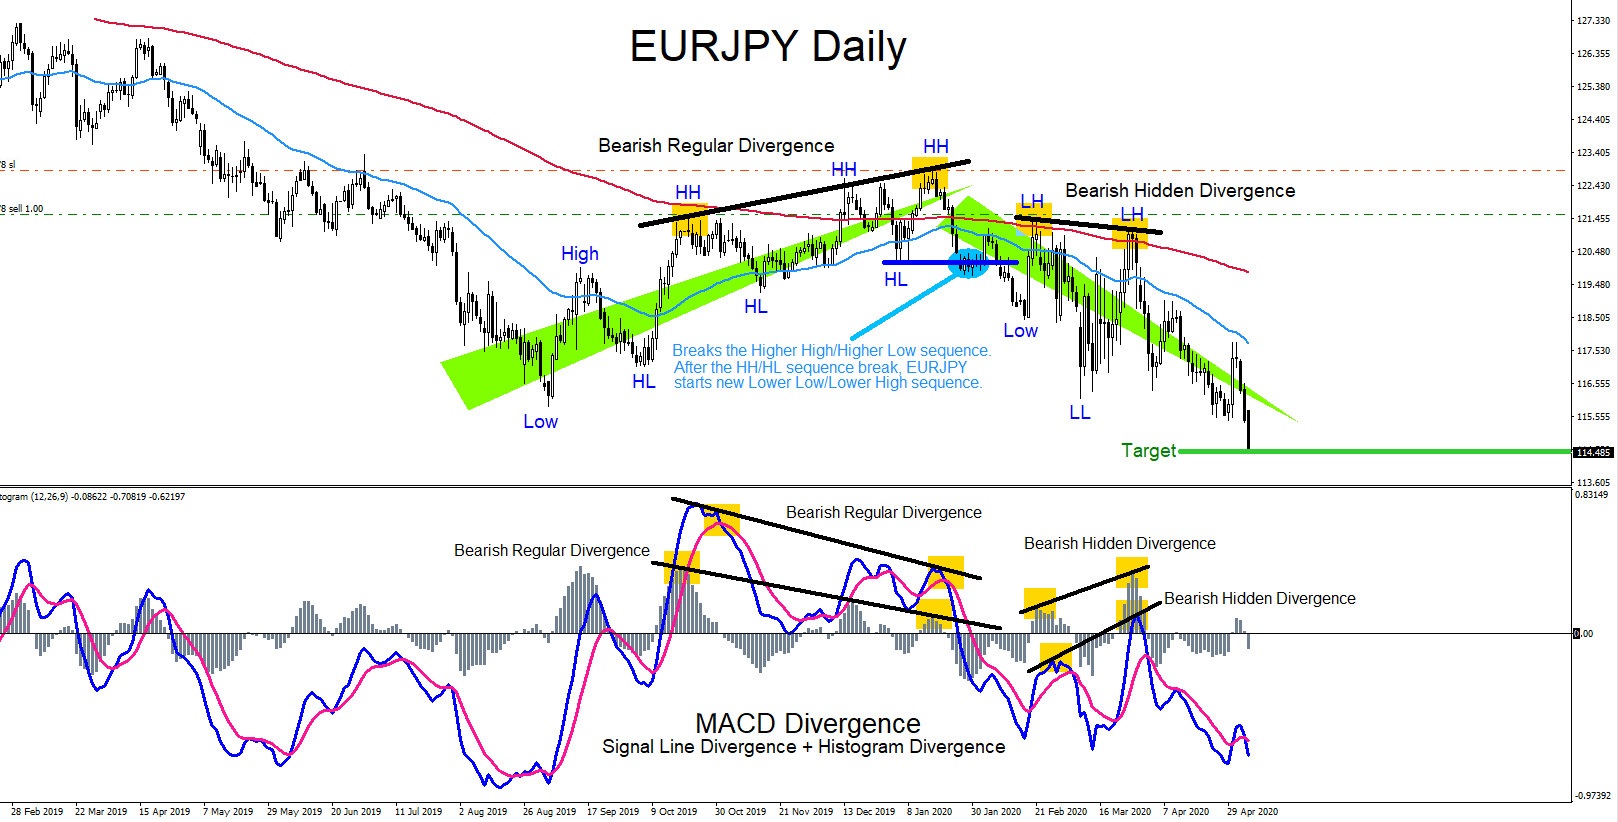
There are many different oscillator indicators that a trader can use to spot divergence patterns. RSI, Stochastic, CCI and MACD are some of the most used. In the EURJPY chart below the MACD indicator was used to spot the patterns to catch the move lower. Most traders just use the signal lines of the MACD to spot divergence. The more consistent way to catch true divergence patterns using the MACD is to spot the patterns on both the signal lines and the histogram simultaneously.
EURJPY Daily Chart May 6/2020 : Regular bearish divergence (trend reversal pattern) was visible in January 2020 when price registered higher highs but the MACD indicator did not. After, price reversed lower and started a downtrend. When price confirmed a downtrend by making lower lows/lower highs a hidden bearish divergence (trend continuation pattern) was visible in March 2020 when price registered a lower high but the MACD indicator registered a higher high. After, price continued the trend lower registering new lower lows and hitting the target level for +710 pips from the January first bearish regular (trend reversal) pattern. *NOTE* Signal lines + histogram together on the MACD indicator was used to spot the patterns.
TIP: Always have multiple strategies all lined up before entering a trade. Never trade using one simple strategy. When multiple strategies line up it allows a trader to see a clearer trade setup.
Of course, like any strategy/technique, there will be times when the strategy/technique fails so proper money/risk management should always be used on every trade. Hope you enjoyed this article and follow me on Twitter for updates and questions> @AidanFX or chat me on Skype > EWF Aidan Chan
*** Always use proper risk/money management according to your account size ***
At Elliottwave-Forecast we cover 78 instruments (Forex, Commodities, Indices, Stocks and ETFs) in 4 different timeframes and we offer 5 Live Session Webinars everyday. We do Daily Technical Videos, Elliott Wave Trade Setup Videos and we have a 24 Chat Room. Our clients are always in the loop for the next market move.