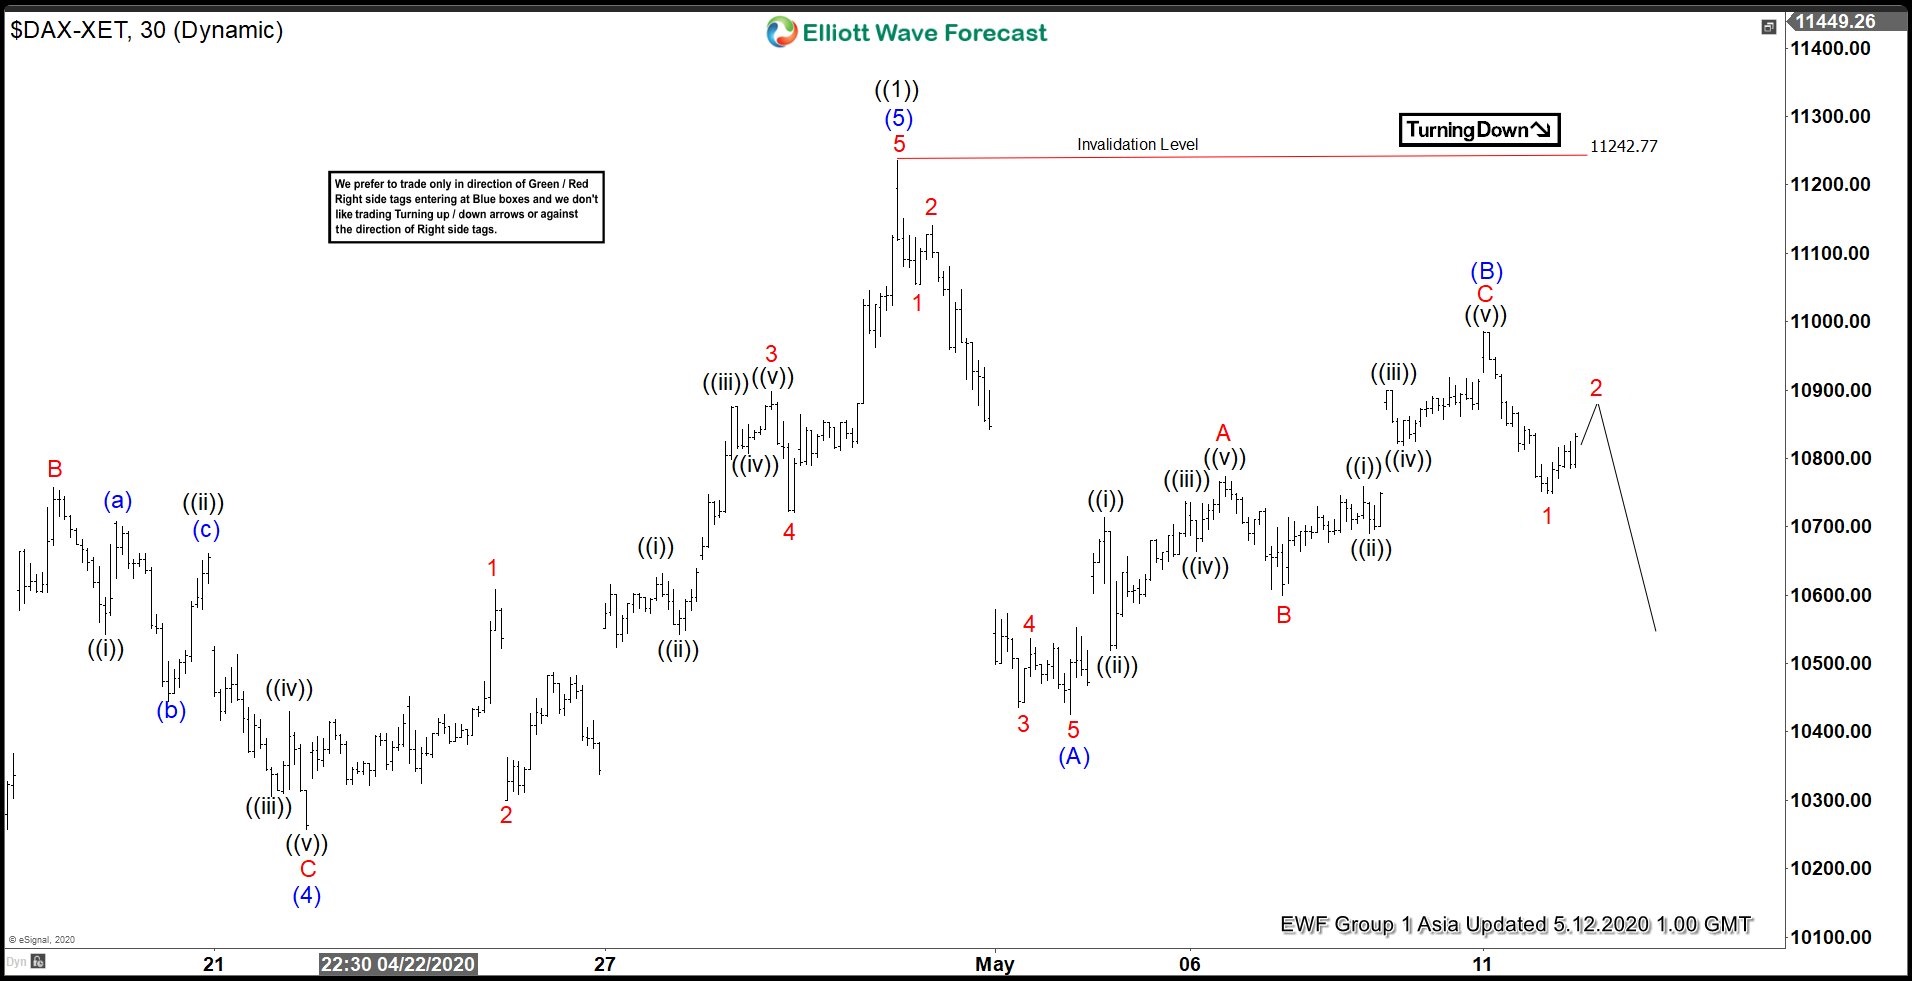
Short Term Elliott Wave view in DAX suggests the rally from 3.16.2020 low ended at 11242.77 as an impulse structure. Up from 3.16.2020 low, wave (1) ended at 9145.93 and pullback in wave (2) ended at 8257.53. Index then resumed higher and ended wave (3) at 10820.17 and wave (4) pullback ended at 10257.27. The 30 minutes chart below shows the Index ended wave (4). Internal of wave (5) unfolded as another impulse in lesser degree.
Up from wave (4) low, wave 1 ended at 10608.39, and dips to 10299.31 ended wave 2. Wave 3 higher ended at 10897.82, wave 4 ended at 10721.42, and wave 5 of (5) ended at 11242.77. This also completed wave ((1)) in higher degree and ended cycle from 3.16.2020 low. Wave ((2)) pullback remains in progress as a zigzag where wave (A) ended at 10426 and wave (B) ended at 10986.22. Down from wave (B), wave 1 ended at 10740.82. Near term, while wave 2 bounce fails below 10986.22, and more importantly below 11242.77, expect Index to resume lower in wave (C) in 5 waves. Potential target of wave (C) lower is 100% – 123.6% Fibonacci extension of wave (A) which comes at 9985 – 10176 area.
DAX 30 Minutes Elliott Wave Chart