Sanofi S.A. is a French multinational pharmaceutical company being within 10 largest pharmaceutical companies in the world. Headquartered in Paris, it is a merger of Aventis and Sanofi-Synthélabo. Sanofi is a part of Euro Stoxx 50 (SX5E) and CAC40 indices. Investors can trade it under the ticker $SAN at Euronext Paris and also under $SNY at NASDAQ. The company is engaged in seven major therapeutic areas. As an example, in recent weeks Sanofi S.A. is also active through Sanofi Pasteur in development of vaccines against COVID-19. Will all this engagement promote the stock price to the new highs?
Sanofi Monthly Elliott Wave Analysis 05.06.2020
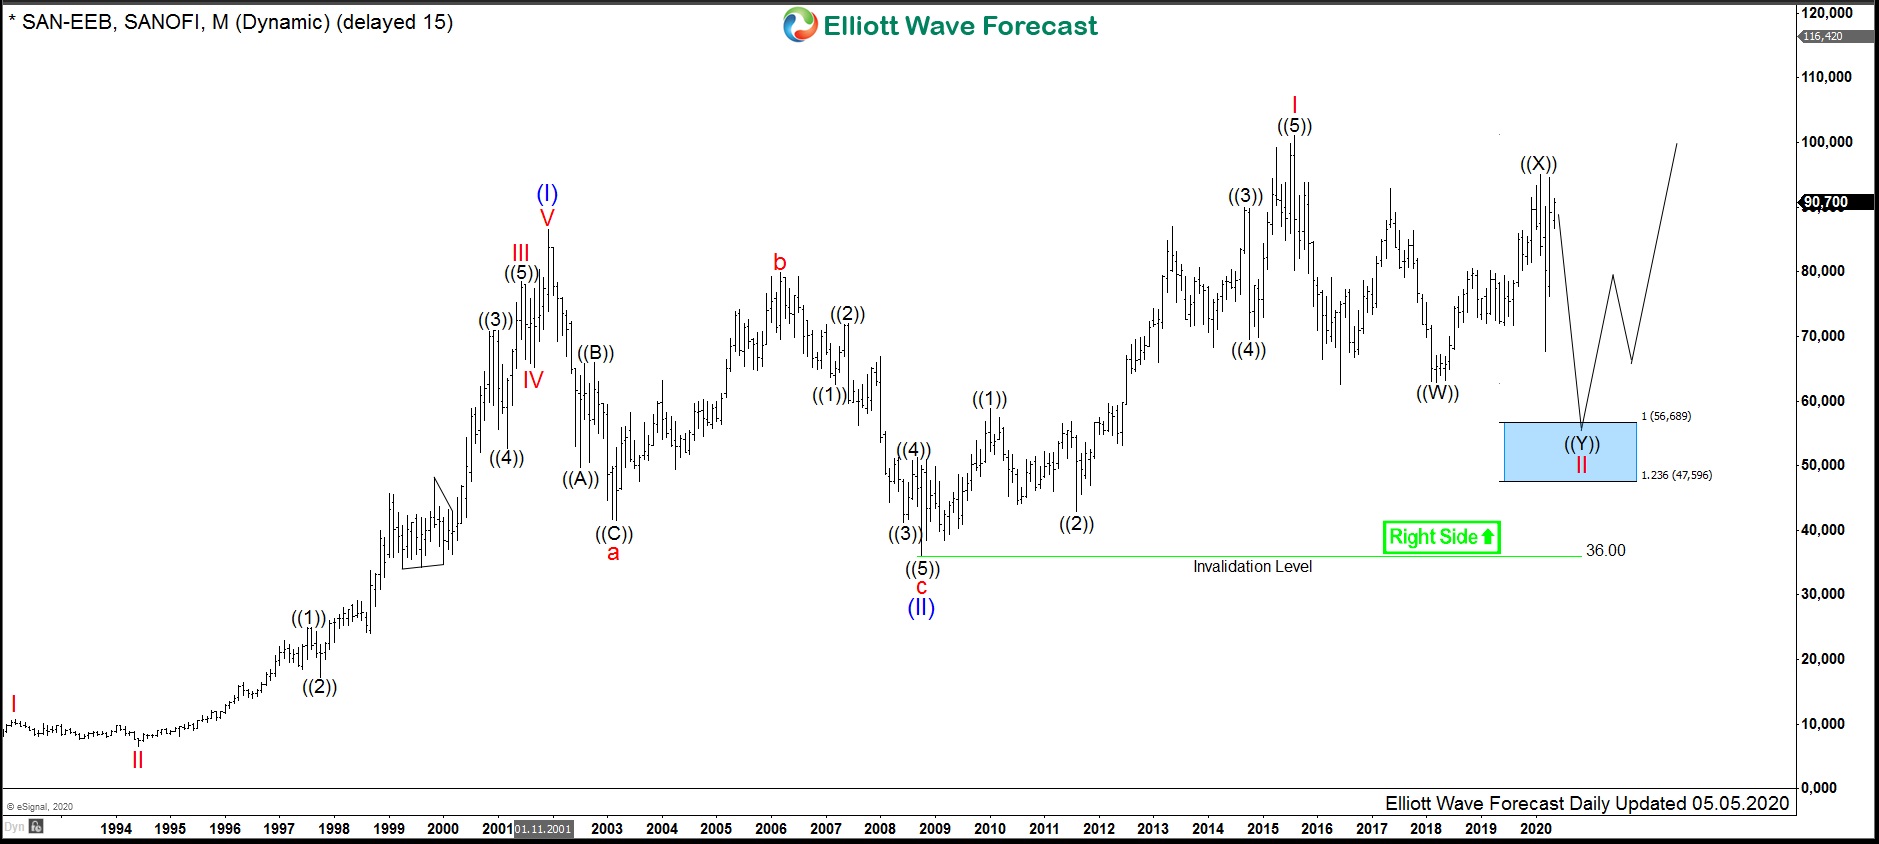
The monthly chart below shows the Sanofi stock $SAN traded at Euronext Paris. From the all-time lows, the stock price is showing an Elliott wave motive wave pattern. The cycle up in blue wave (I) of super cycle degree has ended by printing its top on December 2001 at 86.44. After 5 waves higher in (I), the correction lower in 3 swings of wave (II) has ended on October 2008 at 36.00.
From the 36.00 level, prices made a new high breaking above 86.44 level. As a matter of fact, that action did confirm that the wave (III) is in progress and the buyers can see more upside in the future while the prices remain above 36.00. The cycle from the October 2008 lows in red wave I has ended on 08.2015 at 101.10 being the all-time highs. Within that cycle, one can see 5 subwaves of primary degree. After 5 waves, subsequently, the price consolidation in at least 3 waves should take place. After that, the wave III of (III) may extend higher. So, from the highs at 101.10, price is turning down to correct lower the 2008 cycle.
Sanofi Weekly Elliott Wave Analysis 05.06.2020
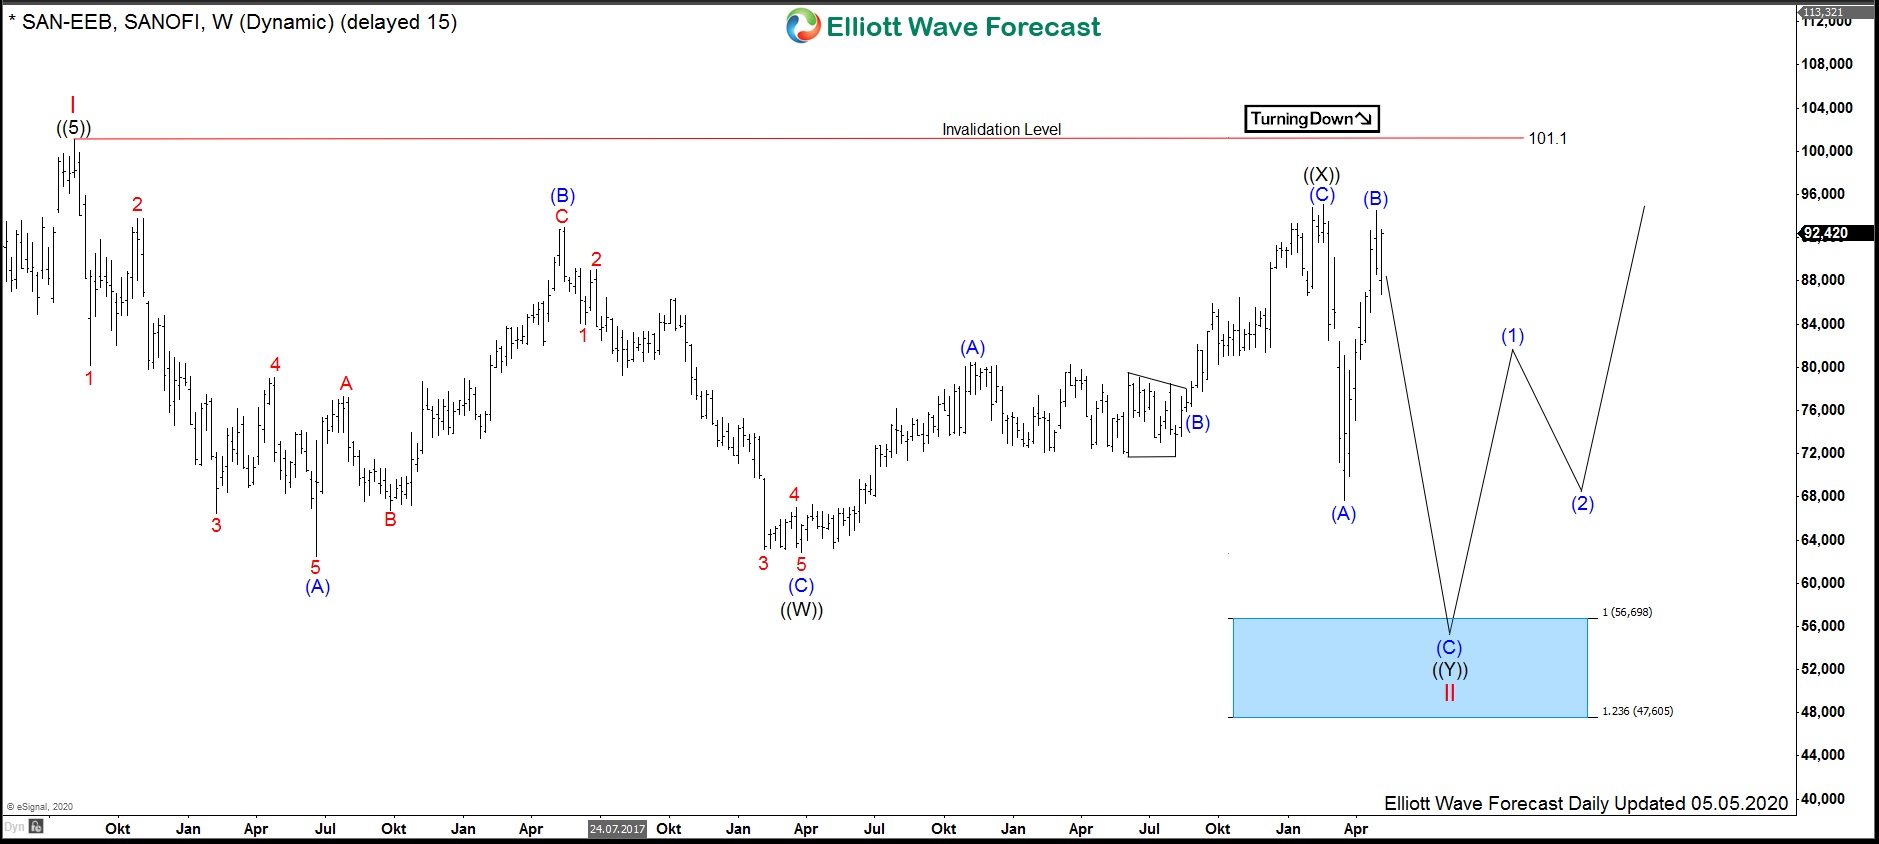
The correction of the cycle higher in wave I from the 08.2015 highs in red wave II lower is shown in detail in the weekly chart below. The decline unfolds as an Elliott Wave double three pattern, i.e., a 3-3-3 structure. First, the cycle in black wave ((W)) has ended on 03.2018. Secondly, the bounce in 3 waves higher in wave ((X)) is favored ended on 02.2020 at 95.09. And finally, wave ((Y)) should end the double three pattern. While below 95.09, the wave ((Y)) may extend lower to the equal legs extension area towards 56.70-47.61. The internal waves (A) and (B) might be in place and the wave (C) can fall lower towards the extreme area.
Therefore, the blue box area 56.70-47.61 can become a great opportunity to enter the market at a good price. Buyers should be waiting there. From the extremes, the Sanofi stock should accelerate in the red wave III towards 101.10 and higher or should bounce in 3 waves at least.