Elliott Wave view in Bank of America (BAC) suggests the decline from January 15, 2020 high is unfolding as a 5 waves impulse. Down from January 15 high, wave (1) ended at 32.47 and bounce in wave (2) ended at 35.45. Stock has resumed lower in wave (3) which ended at 17.95. Bounce in wave (4) is proposed complete at 25.35 as a zigzag.
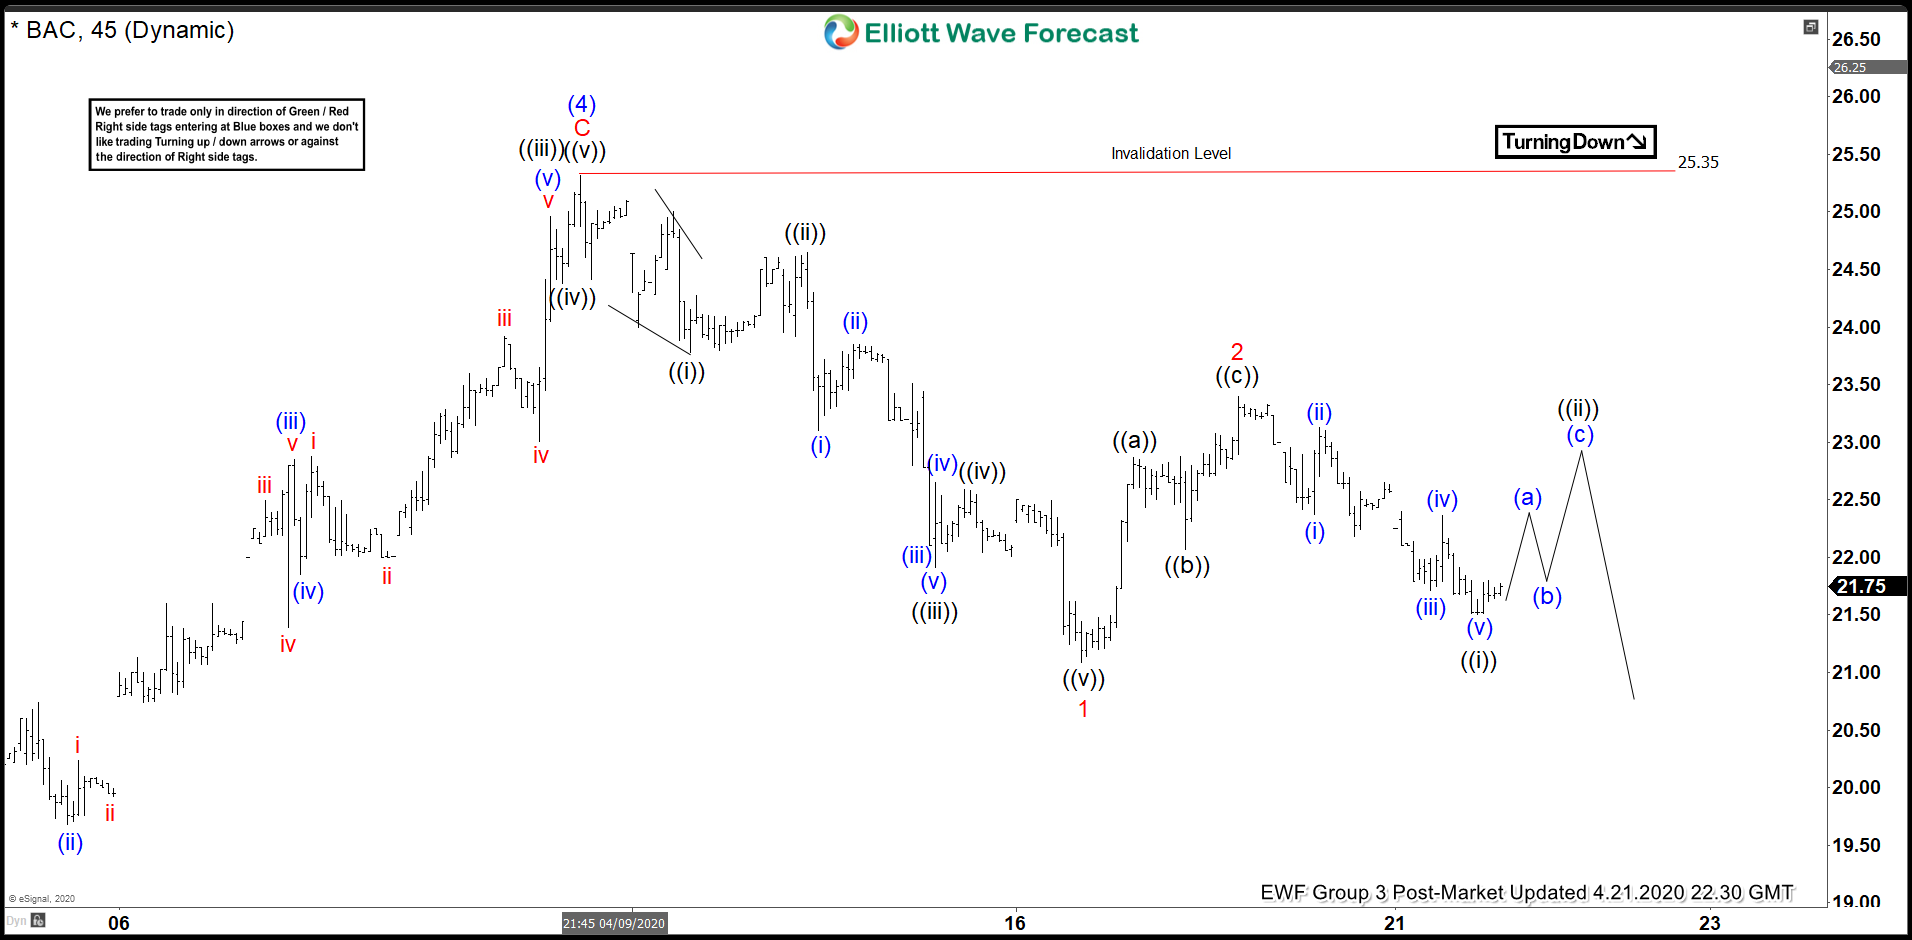
Short term 45 minutes chart below shows the stock ended wave (4) bounce at 25.35. This level is now the short term invalidation level for more downside. Internal of wave (4) unfolded as a zigzag where wave A ended at 23, wave B ended at 19.51, and wave C of (4) ended at 25.35. While below 25.35, wave (5) lower is currently in progress as an impulse, but BAC still needs to break below wave (3) at 17.95 to avoid a double correction.
Down from 25.35, wave 1 ended at 21.09 and wave 2 bounce ended at 23.40. Near term, while rally fails below 25.35, expect Bank of America to extend lower within wave (5). Potential target lower is 123.6 – 161.8% external extension of wave (4) which comes at 13.3 – 16.1.
BAC 45 Minutes Elliott Wave Chart