
$CPER Copper Index Tracker Elliott Wave & Long Term Cycles
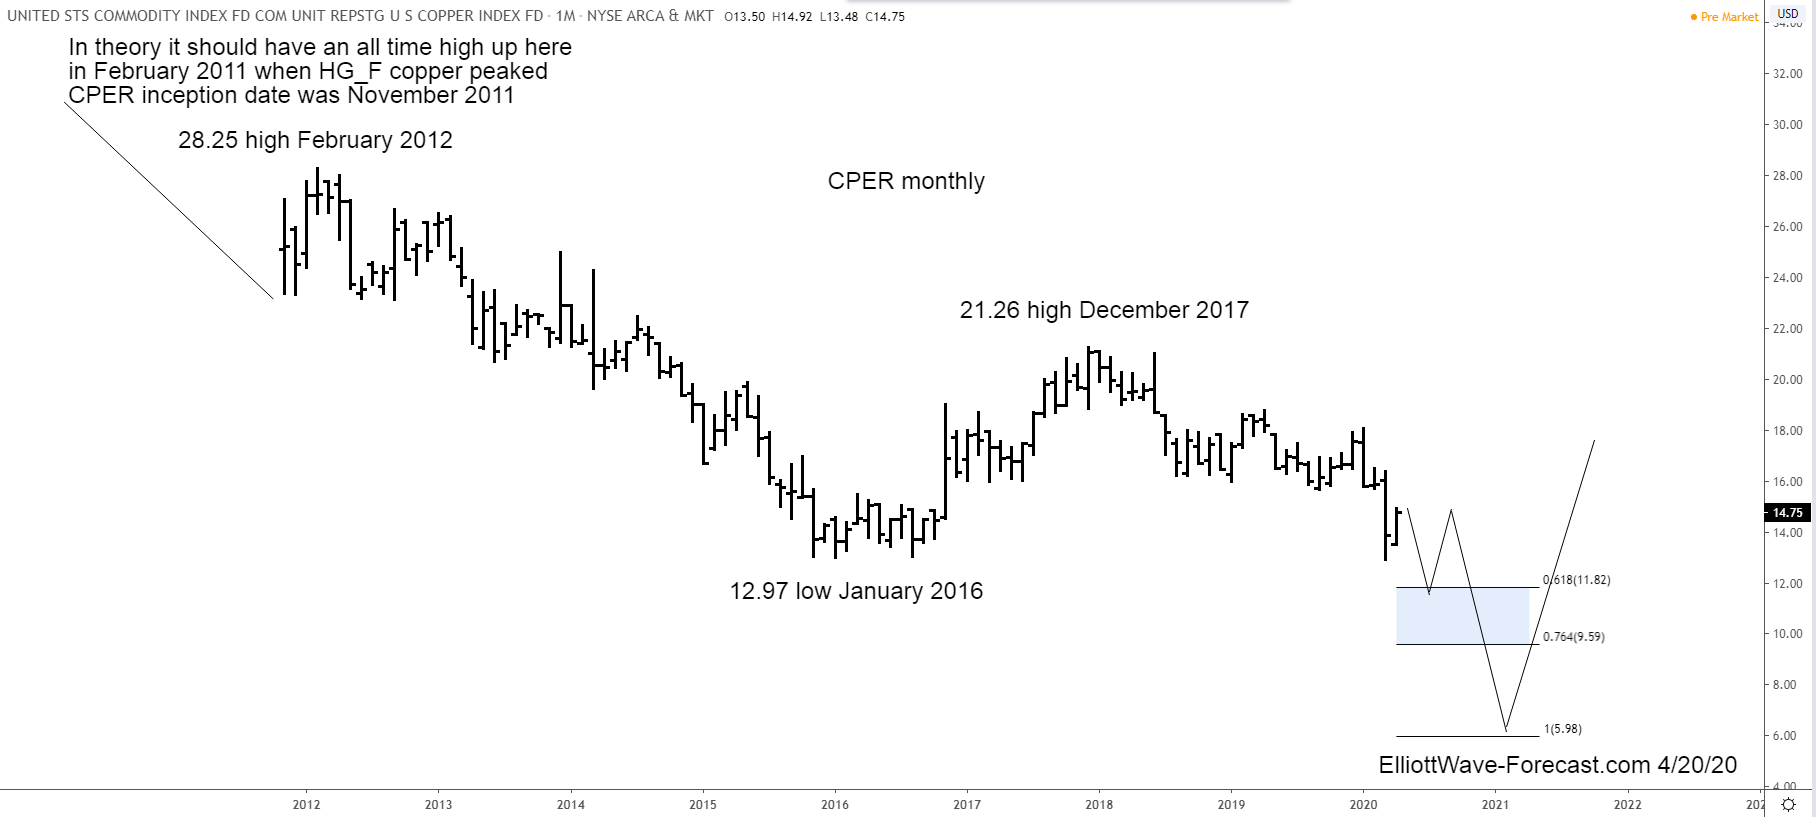
Firstly the CPER Copper Index Tracking instrument has an inception date of 11/15/2011. There is data in the HG_F copper futures before this going back many years. That shows copper made an all time high on February 15th, 2011 at 4.649. Translated into this instrument, it is mentioned on the monthly chart. The decline from there into the January 2016 lows appeared to have been a double three in the commodity HG_F. Thus I will work with that idea in this CPER instrument.
The analysis continues below the CPER monthly chart.
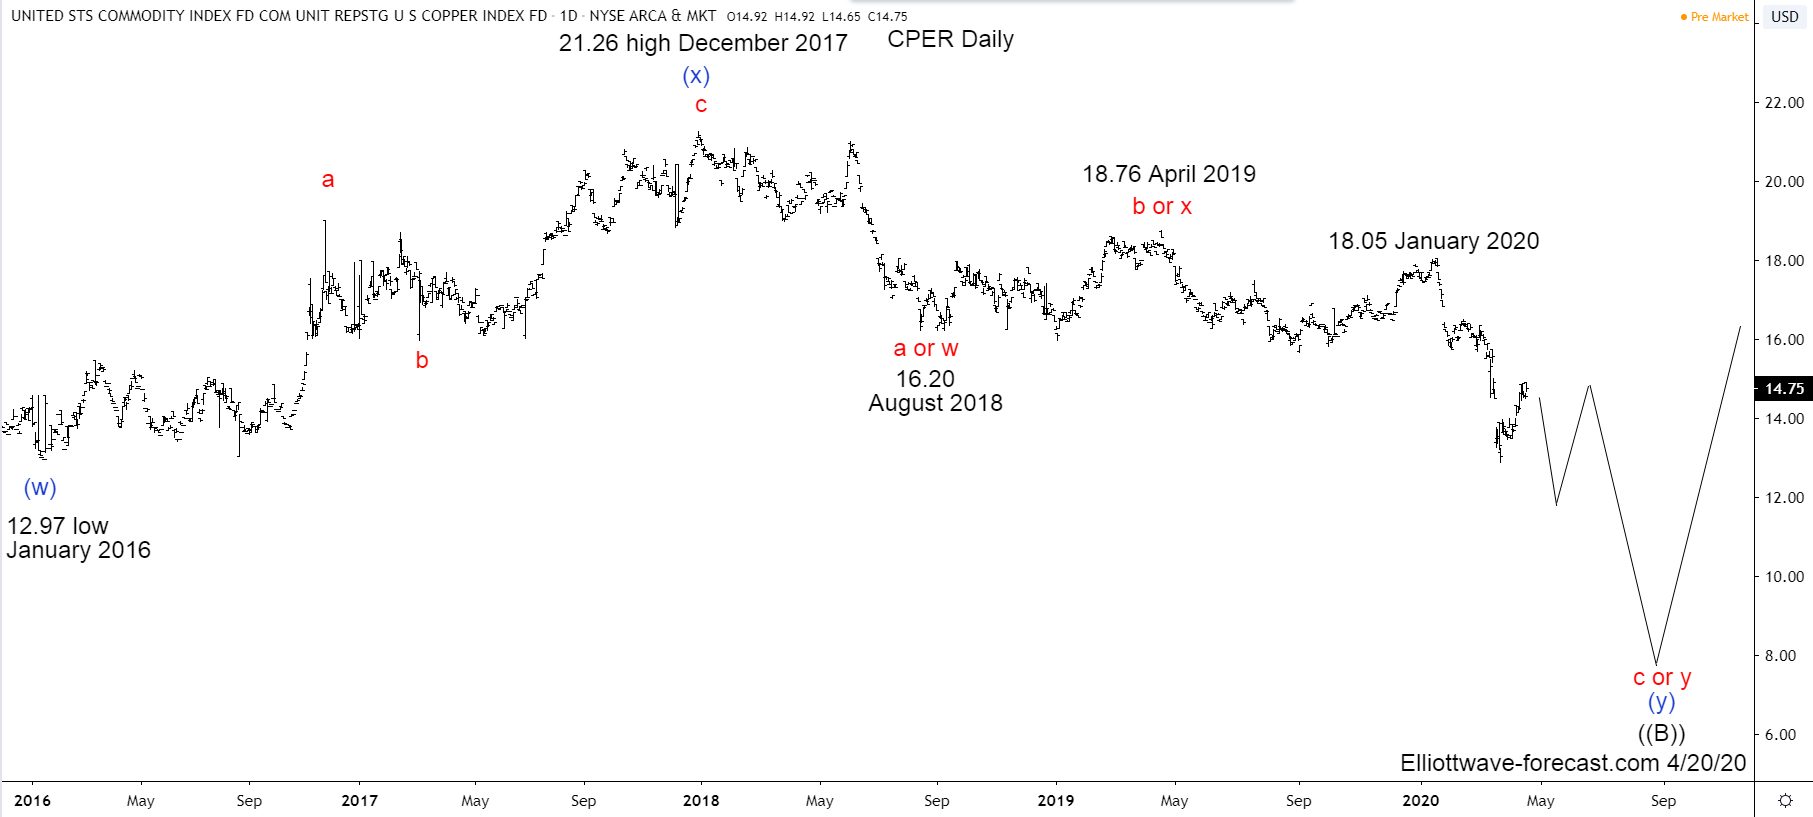
Secondly the CPER Copper Index Tracking instrument from the all time highs made what is favored to be a double three correction lower in the wave (w). This is seen on the daily chart below that ended at the 12.97 lows in January 2016. From the January 2016 lows up into the December 2017 highs appeared to be a double three structure. The bounce was strong enough on momentum indicators to suggest it had ended the cycle lower from the all time highs. This is as reflected in the monthly chart shown above.
The analysis continues below the CPER daily chart.
Thirdly, the CPER Copper Index Tracking instrument decline from the December 2017 highs is very ambiguous. This means it is open to more than one interpretation as is most any chart by an Elliott wave analyst. The key points here are as follows. As can be seen the 12.87 low from March 20th 2020 created a bearish sequence by taking out the lows from January 2016. This means it is in a 5th swing lower from the all time highs. The 5th swing target area is highlighted at 11.82-9.59 on the monthly chart above. From there it should bounce to correct the cycle from the December 2017 highs. This will be the 6th swing. It may be either shallow or a larger bounce relative to the decline from there.
In conclusion: While the 6th swing bounce remains below the December 2017 highs it should see another round of weakness toward the 5.98 area in the 7th swing lower from the all time highs. That is the area where the technicals suggest it can see a turn back higher from.