Decline from April 23, 2019 high in Oil (CL_F) remains in progress as a 5 waves impulse. Down from April 23, 2019 high, wave (1) ended at 50.6 and wave (2) bounce ended at 65.65. Oil then resumed lower in wave (3) to 19.46, and wave (4) bounce ended at 29.21. Short term chart below shows wave (4) at 29.21 which ended on April 4. Oil has broken below March 30 low (19.27), suggesting wave (5) has resumed. The internal subdivision of wave (5) is unfolding as a 5 waves impulse structure. Down from April 4 high, wave 1 ended at 25.28. Bounce in wave 2 unfolded as an expanded Flat where wave ((a)) ended at 28.24, wave ((b)) ended at 23.54, and wave ((c)) of 2 ended at 28.36.
Wave 3 is in progress and unfolding as another 5 waves of lesser degree. Down from 28.36, wave ((i)) ended at 22.03 and bounce in wave ((ii)) ended at 24.57. Oil then resumed lower in wave ((iii)) as an impulse and ended at 19.20 while bounce in wave ((iv)) ended at 20.60. Near term, expect Oil to extend lower in wave ((v)) before ending wave 3. Afterwards, it should bounce in wave 4 then resume lower 1 more leg. As far as pivot at 29.21 high on April 4 remains intact, expect Oil to see further downside.
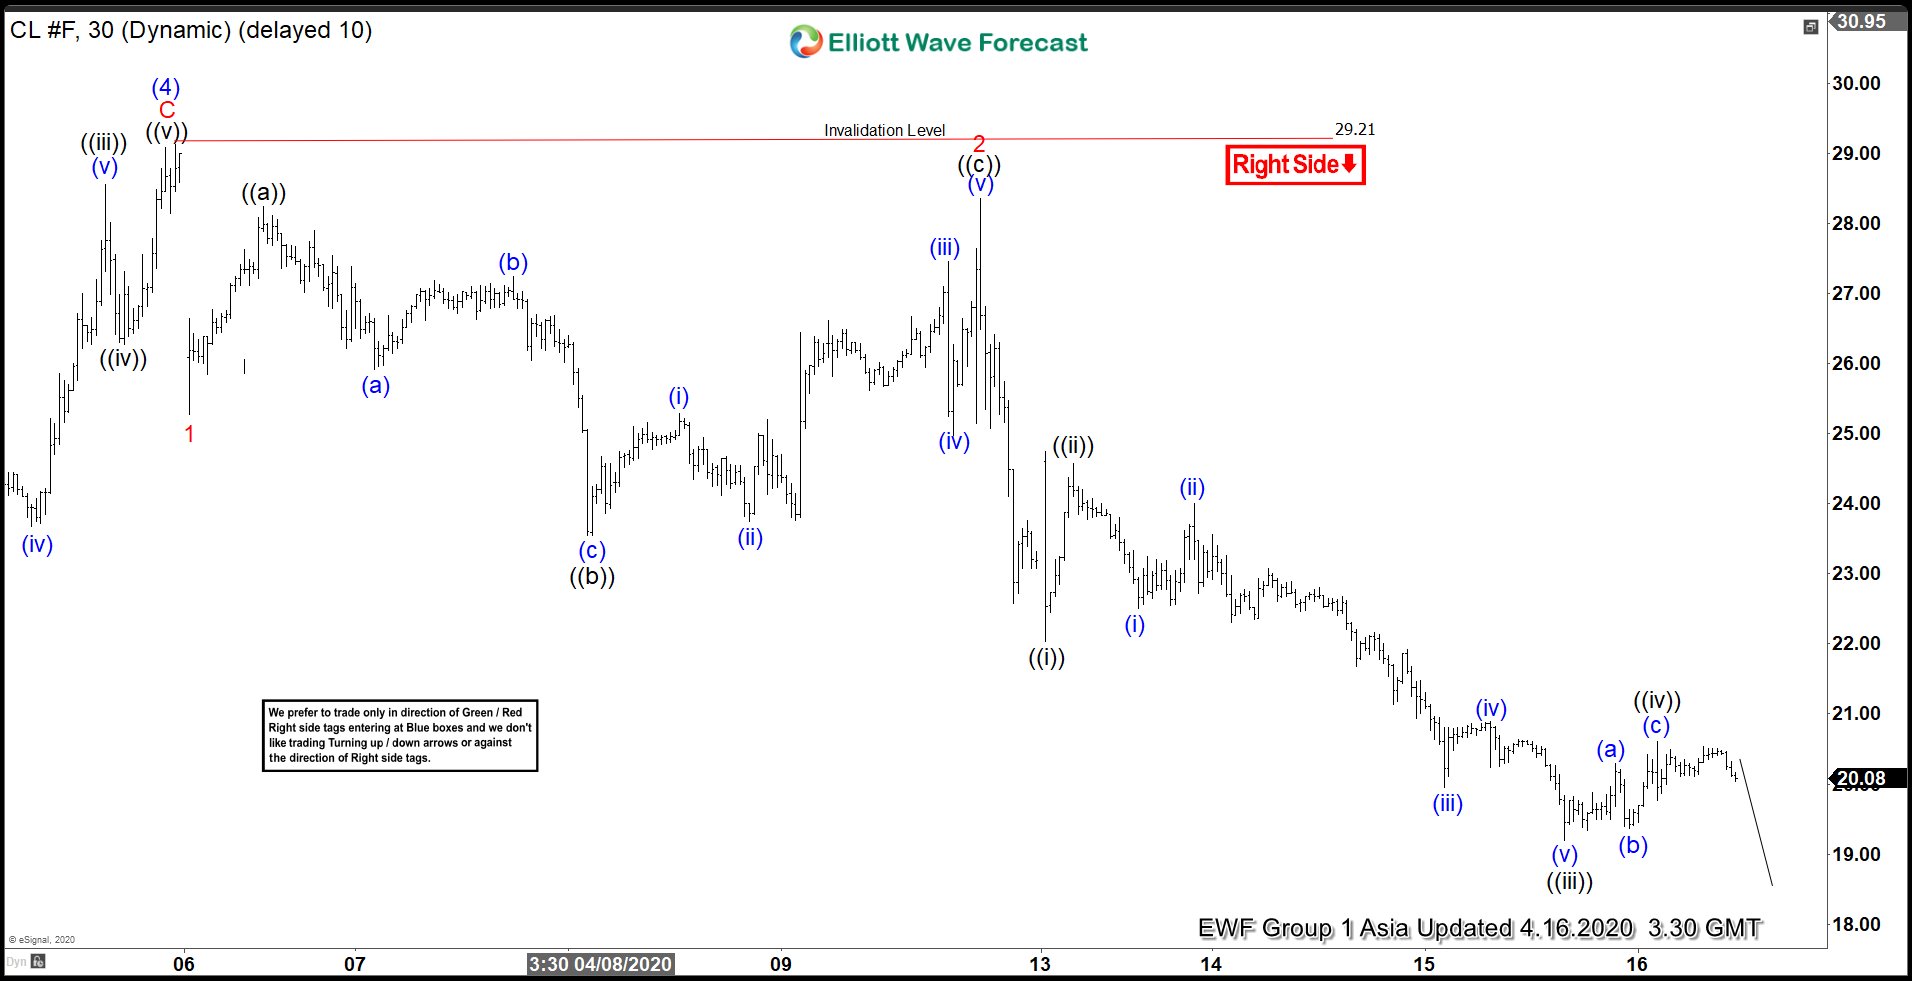
Oil (CL_F) 1 Hour Elliott Wave Chart