Deutsche Lufthansa AG is the largest german airline being part of the DAX30 index. Moreover, the company is the second largest company in Europe in terms of passengers carried. However, the stock price of Lufthansa has not carried that much of financial success into the purses of the investors. Indeed, since January 2018 the stock price is in a steady decline. The circumstances of 2020 spring Corona chaos might have accelerated the fall even thurser.
Lufthansa Weekly Elliott Wave Analysis 04.12.2020
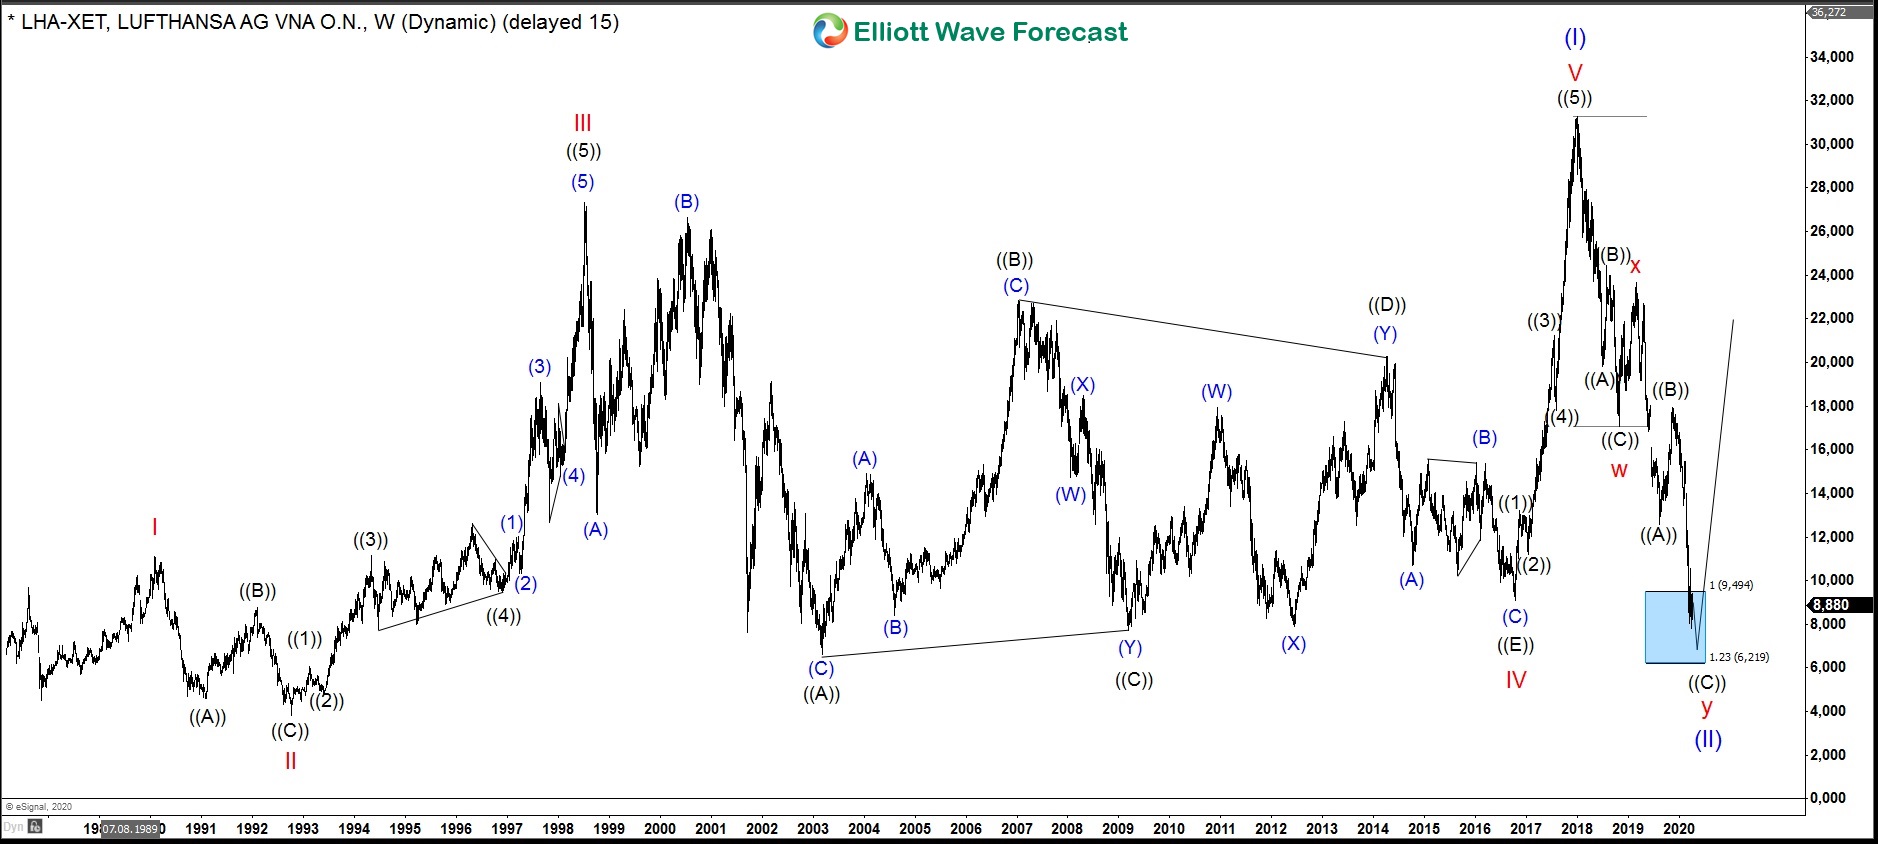
The weekly chart below shows the Lufthansa stock $LHA traded at XETRA. From 1987 lows, the stock price has developped an Elliott wave leading diagonal pattern. The cycle up in blue wave (I) being of super cycle degree has ended by printing its top on January 2018 at 31.18. Hereby, the internals of the leading diagonal are 5-3-5-3-5. The red waves I and IV do overlap which is a typical feature of the diagonals.
First, the wave I has topped on 02.1990. Thereafter, a zigzag lower in red wave II has corrected this advance. From the 09.1992 lows, the rally in red wave III to the highs contains 5 subwaves of primary degree. From the important top on 07.1998 at 27.38, red wave IV has deveveloped over 10 years duration a contracting triangle pattern. Finally, from 10.2016 lows, the triangle has resolved itself in a thrust in red wave V towards the all time highs on 01.2018 at 31.18. Now, after a 5 waves advance, according to Elliott Wave theory, we should expect a consolidation in 3 waves lower.
Lufthansa Daily Elliott Wave Analysis 04.12.2020
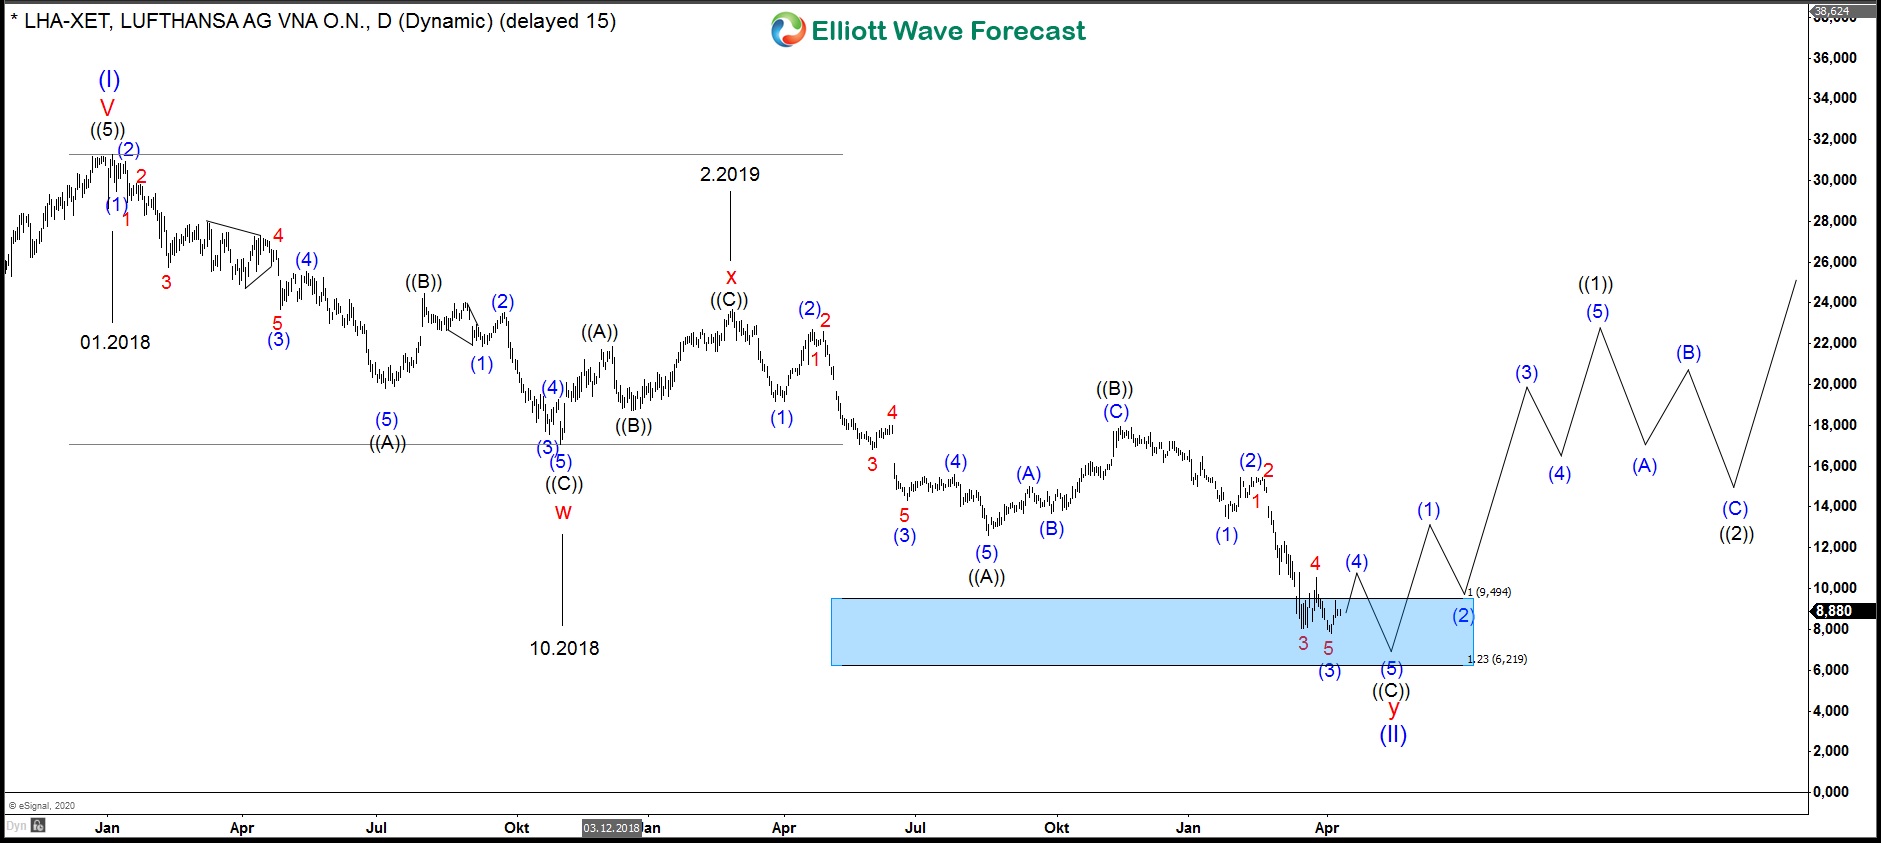
The correction of the super cycle in wave (I) from the 01.2018 highs in blue wave (II) lower can be better seen in detail in the daily chart below. The decline has unfolded so far as a double zigzag correction pattern, i.e., a 7 swings structure. The red wave w has ended on 10.2018, a connector in red wave x has printed its top on 02.2019. From there, the 5th swing lower in black wave ((A)) has ended on 08.2019 opening up a bearish sequence. After a bounce as a swing #6 in wave ((B)), the 7th swing lower in black wave ((C)) is extending lower and might be still in progress. The red wave y has already reached the extension area towards 9.494-6.219 where buyers may enter the market.
However, the equality bias between the waves ((A)) and ((C)) may force a bit of more weakness. While below 11.665, $LHA may extend lower within the blue box towards 6.888. From there, the stock price should resume the rally in wave (III) towards 31.18 and higher. Finally, Lufthansa stock is going to fly again … like the airplanes which always did.