In this technical blog, we are going to take a look at the past 1-hour chart’s performance of the Soybean Futures. But before looking further into the Charts, we must need to understand the market nature first. The market always fights between the two sides i.e Buying or Selling. We at Elliott Wave Forecast understand the Market Nature and always recommend trading the Elliott wave hedging or no enemy areas. Those areas are reflected as the blue box areas on our charts. They usually give us the reaction in favor of market direction in 3 swings at least. Now, let us take a quick look at the Soybean 1 Hour Charts and structure below:
Soybean 1 Hour Elliott Wave Chart
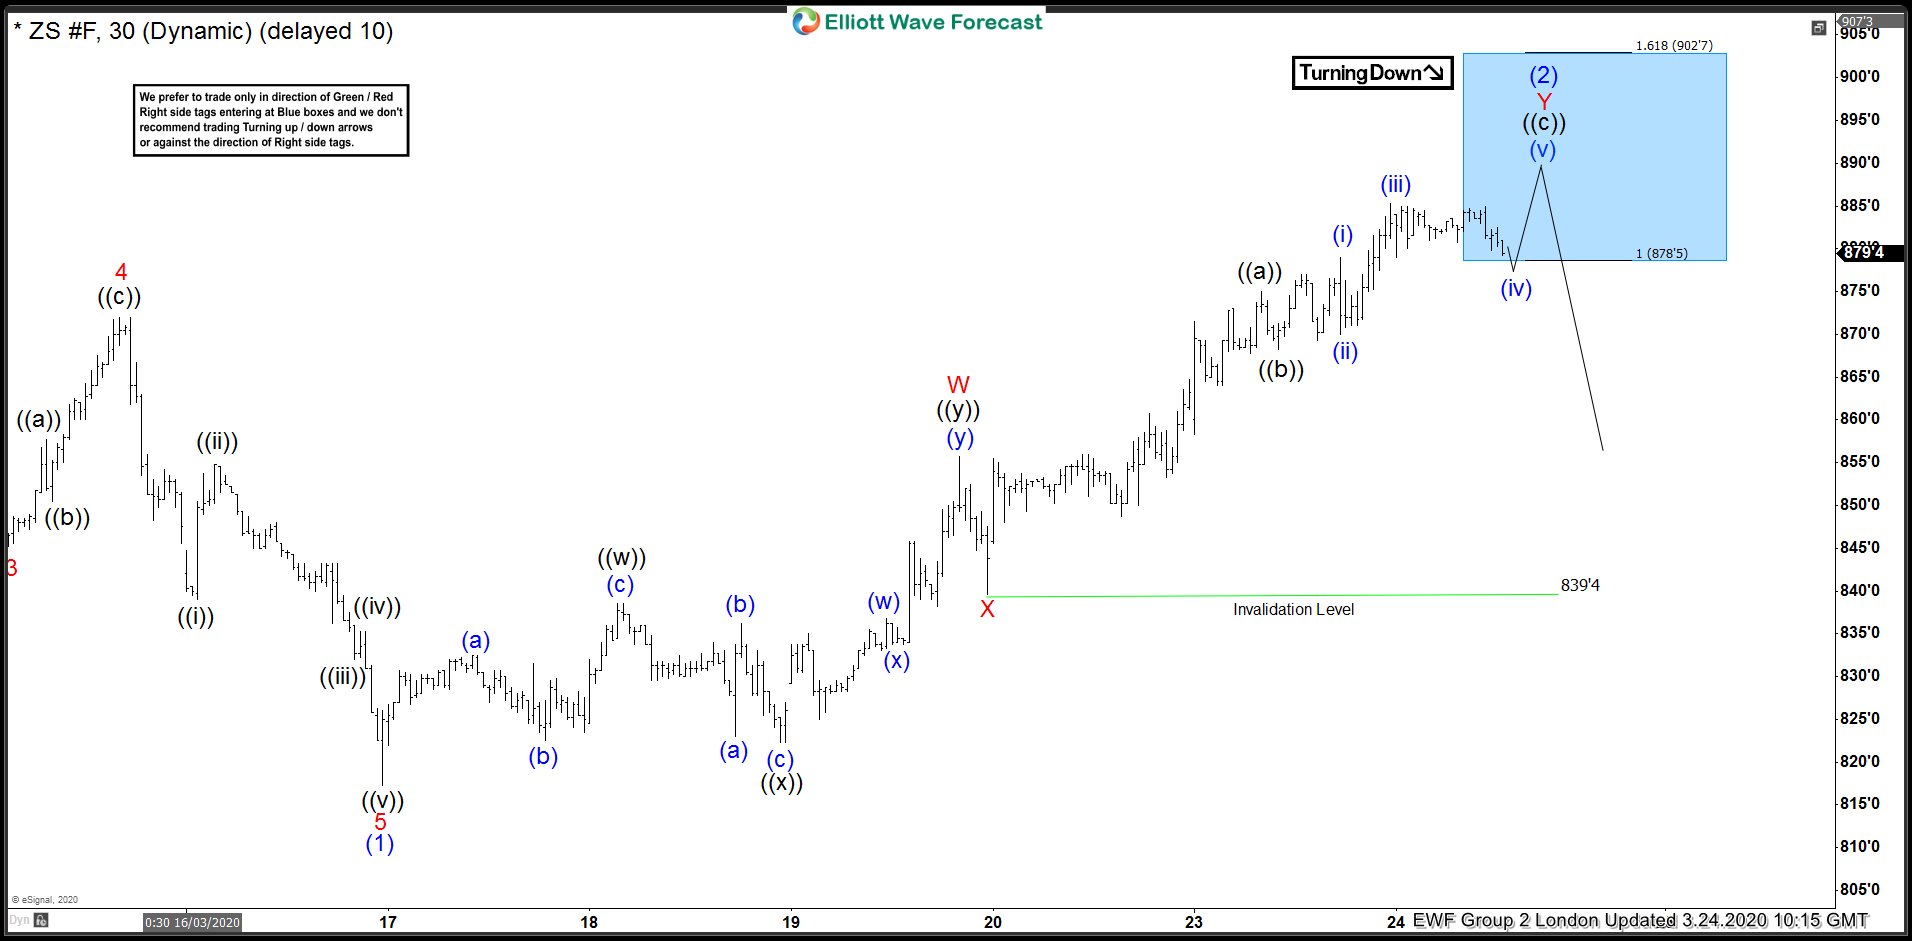
Soybean 1 Hour Elliott Wave Chart from 3/24/2020 London update. In which, the decline to $821 low ended wave (1) as impulse structure. Up from there, the instrument made a wave (2) bounce to correct the cycle from January 2020 peak. The internals of that bounce unfolded as Elliott wave double three structure where wave W ended in 3 swings at $855.6 high. Wave X pullback ended at $839.4 low and wave Y managed to reach the blue box area at $878.5- $902.7 100%-161.8% Fibonacci extension area of W-X. From there, Soybean was expected to find sellers looking for more downside or for 3 wave reaction lower at least.
Soybean Latest 1 Hour Elliott Wave Chart
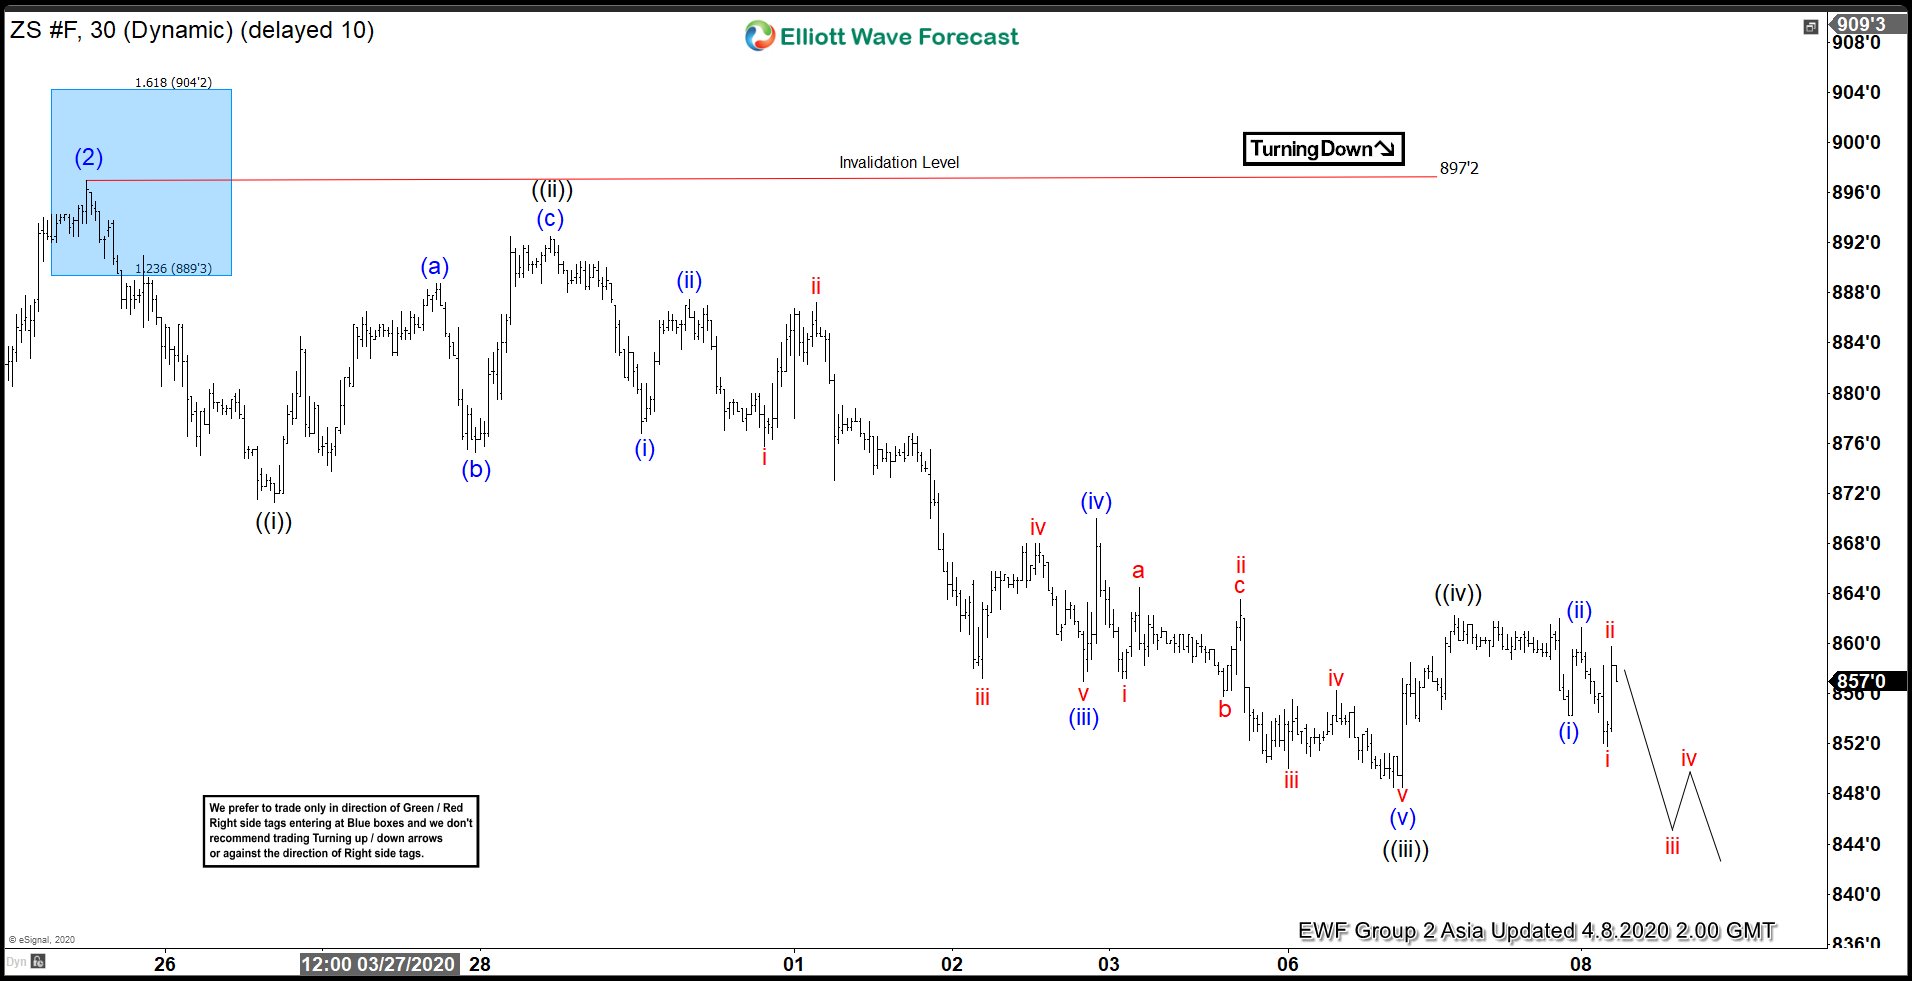
Here’s Latest 1 Hour Elliott Wave Chart of Soybean Futures, showing reaction lower taking place from the blue box area. Allowed members to create a risk-free position shortly after taking short position at $878.5- $902.7 blue box area.