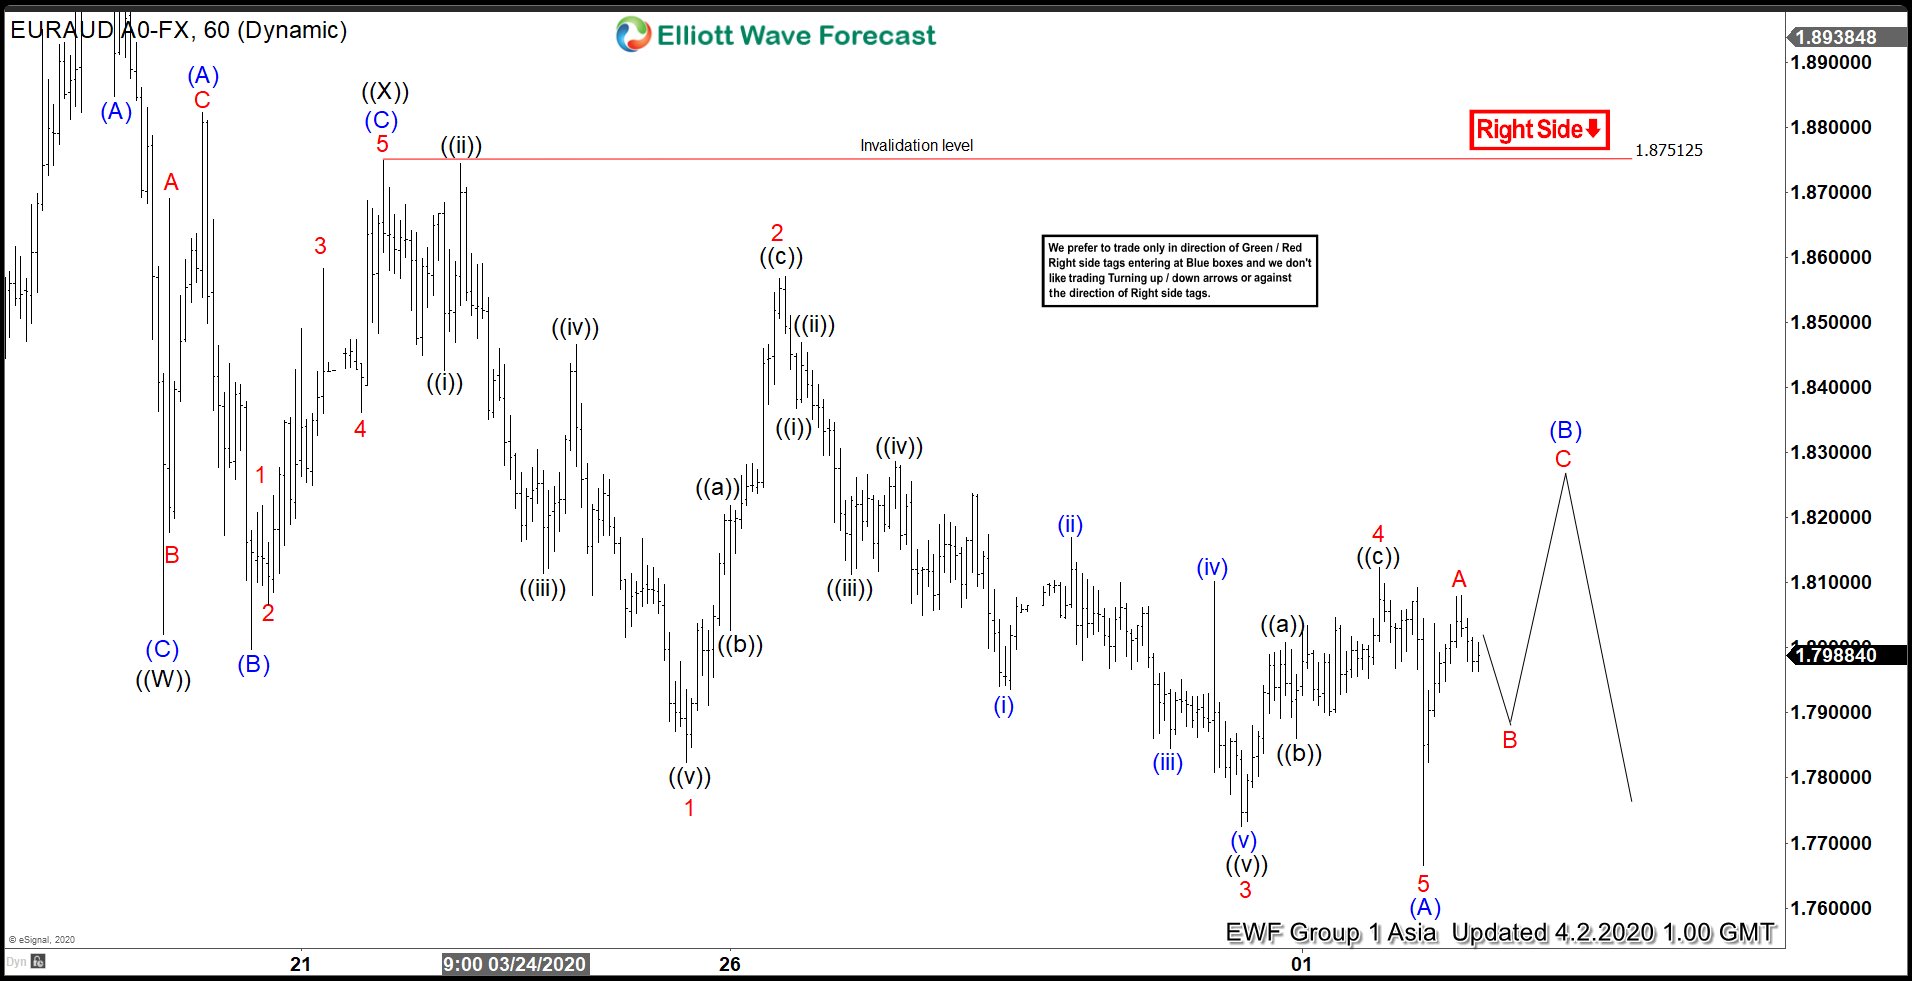
EURAUD shows incomplete sequence from March 19, 2020 high, favoring further downside. The internal of the decline from March 19 (1.98) high is unfolding as a double three Elliott Wave structure. Down from 1.98 high, wave ((W)) ended at 1.802 and wave ((X)) bounce ended at 1.875 as a running Flat. Pair has resumed lower in wave ((Y)) which is unfolding as a zigzag.
Down from 1.875, wave 1 ended at 1.782, and wave 2 bounce ended at 1.857. Pair then resumed lower in wave 3 towards 1.772 and wave 4 bounce ended at 1.812. Pair then ended the last leg lower wave 5 at 1.766. The 5 waves move lower ended wave (A) of the zigzag. Wave (B) is now in progress to correct cycle from March 23 high before pair resumes lower again. Internal of wave B is unfolding as a zigzag. Up from 1.766, wave A ended at 1.808. While pullback in wave B stays above 1.766, expect pair to extend higher in wave C of (B) before the decline resumes. Potential target lower is 100% – 123.6% Fibonacci extension from March 19 high which comes at 1.655 – 1.697 area.
EURAUD 1 Hour Elliott Wave Chart


