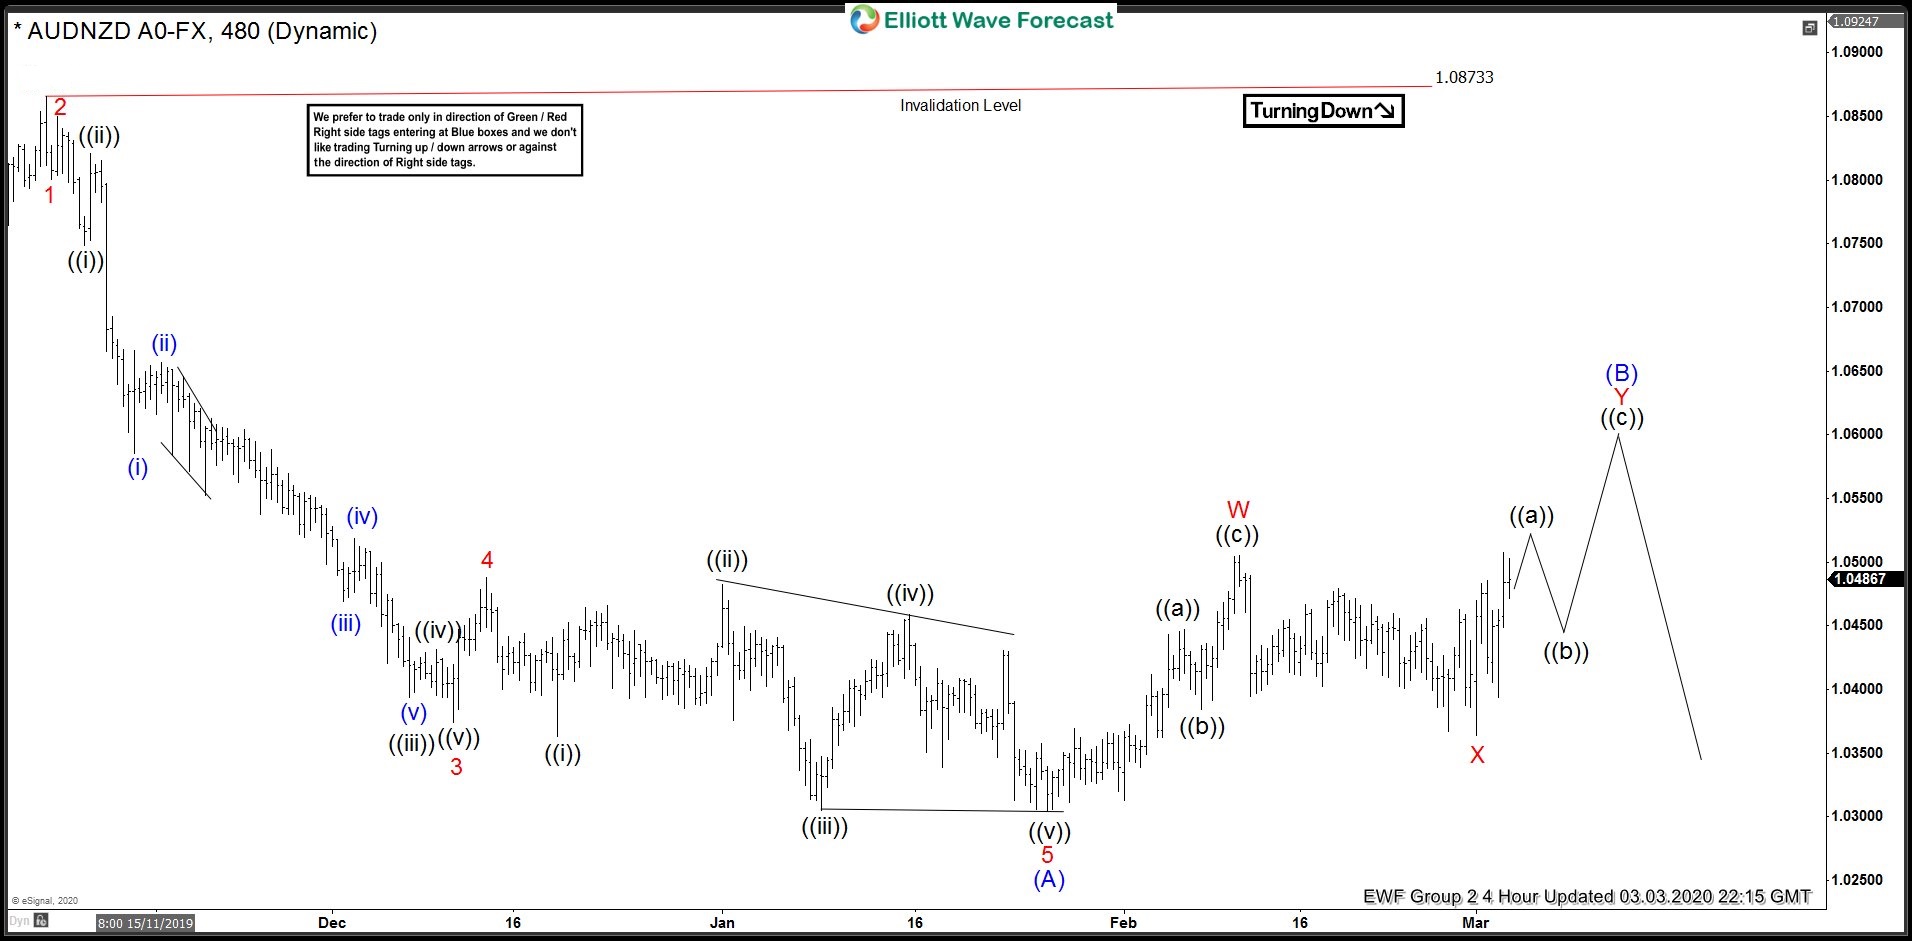
In this blog, we are going to take a look at the Elliottwave chart of AUDNZD. The chart below from March 3 update shows that the cycle from November 8, 2019 high unfolded as 5 waves impulsive structure. The move down in wave (A) ended at 1.0304 low. Based on Elliottwave theory, a 3 waves bounce should happen after the impulsive wave, before the downside resume. As long as the pivot at 1.08733 high stays intact, the bounce in 3,7, or 11 swings is expected to fail. The pair can continue to extend lower afterwards. We were expecting the bounce to unfold as a double three. Therefore, the pair could still make another high before ending the bounce in wave (B).
AUDNZD 3.3.2020 4 Hour Elliott Wave Update
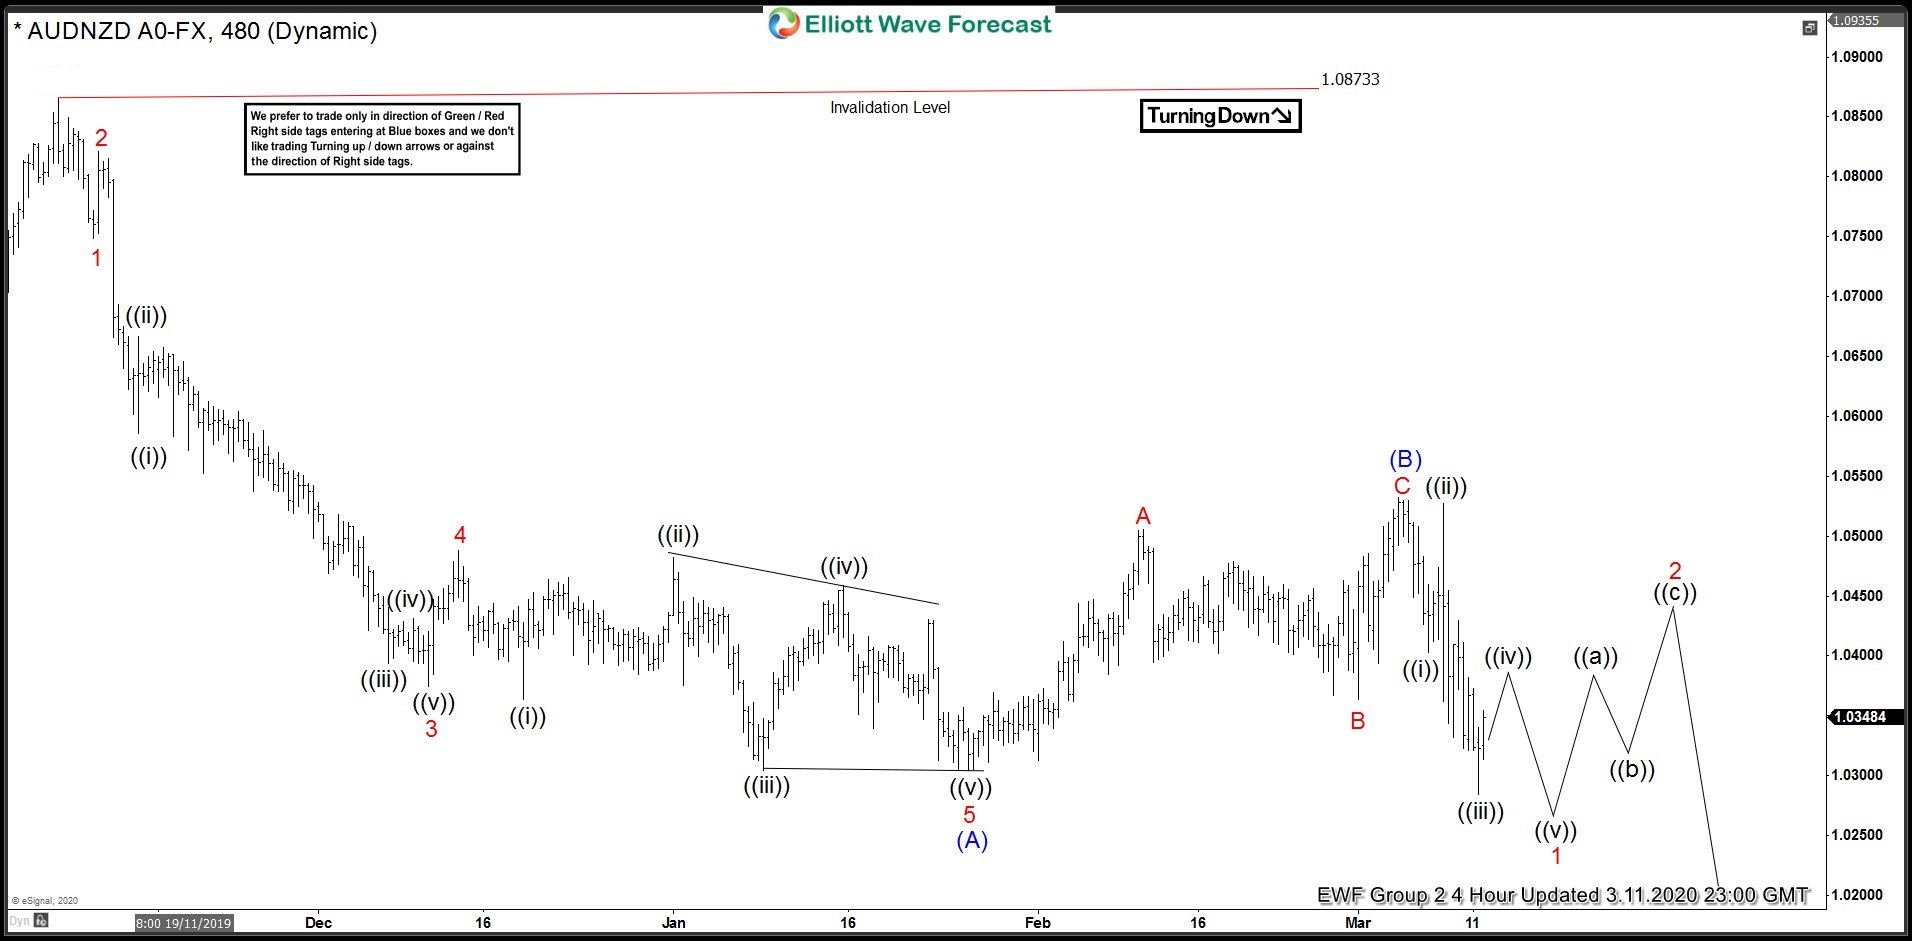
The chart below from March 11 update shows that the pair made another high and ended wave (B) bounce as a zig-zag structure instead. Wave (B) ended at 1.0534 high. From there, the pair extended lower and broke below previous wave (A) high. This confirmed that the next leg lower in wave (C) has started and wave (B) bounce is in place.
AUDNZD 3.11.2020 4 Hour Elliott Wave Update
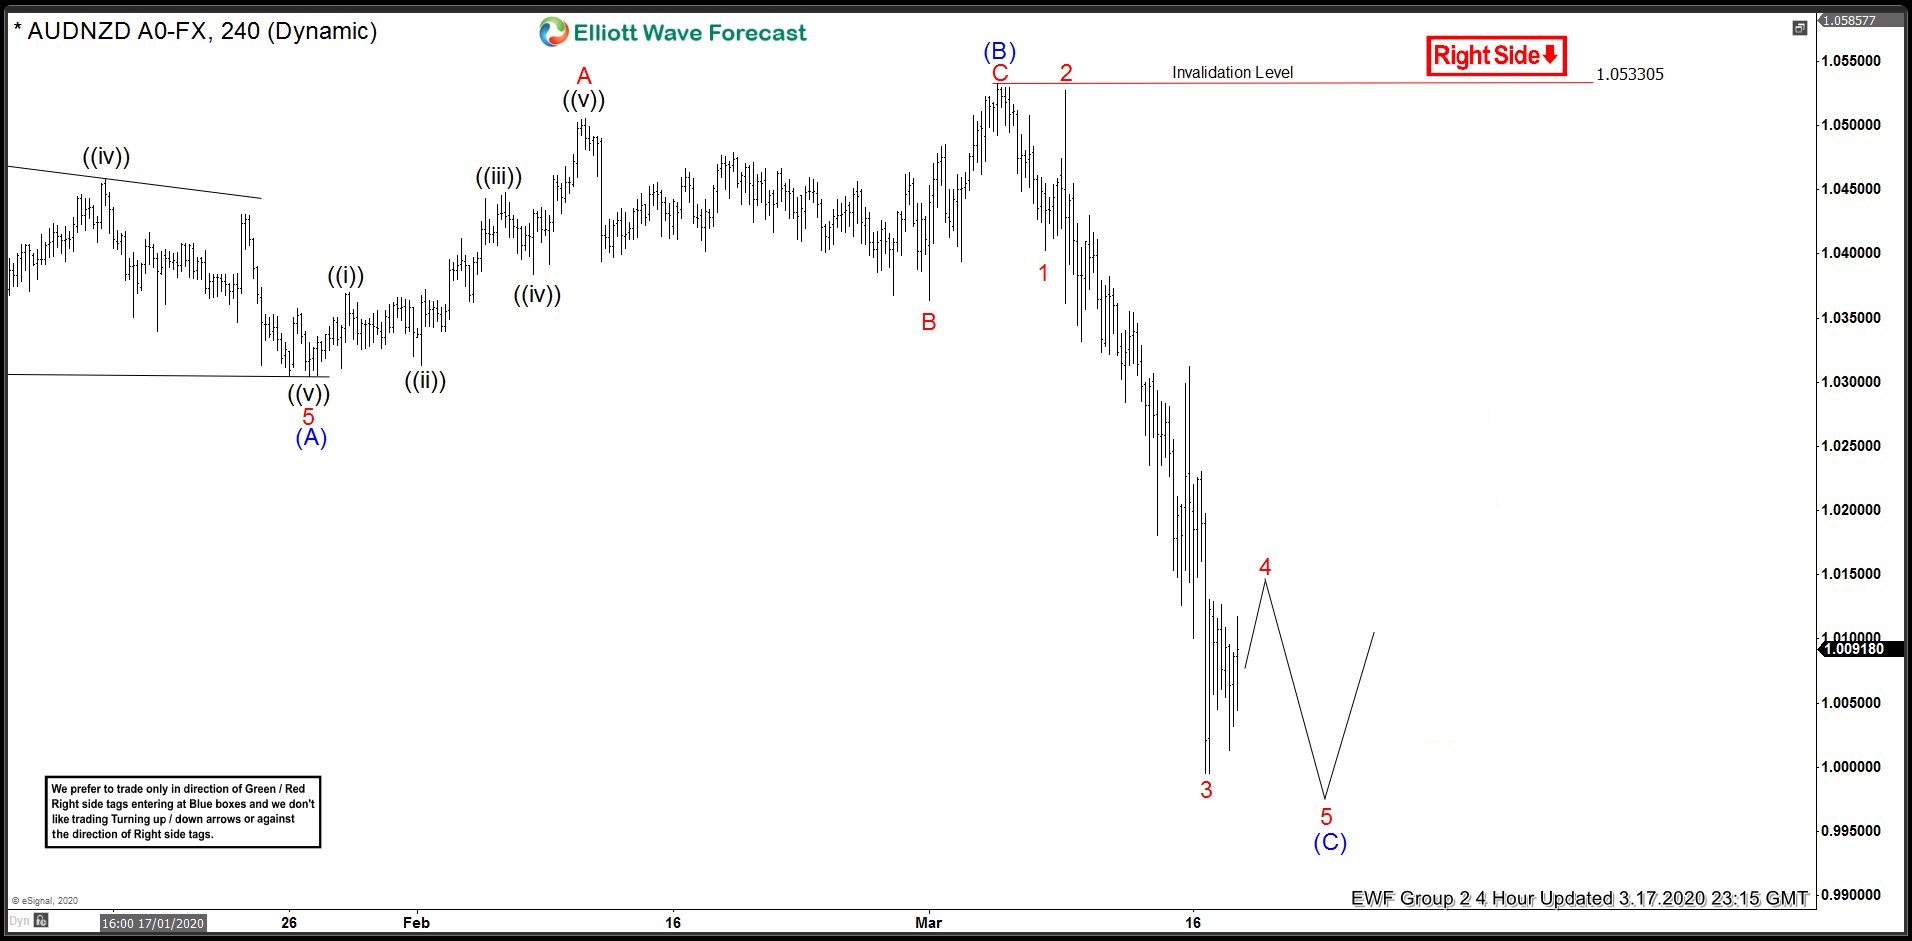
The chart from March 17 update shows that AUDNZD continued to extend lower after breaking wave (A) low. Near term, the pair is doing a bounce in wave 4. However, while below 1.0533 high, expect the bounce in 3,7 or 11 swings to fail. The pair can still make another low to end 5 waves move down.
AUDNZD 3.17.2020 4 Hour Elliott Wave Update