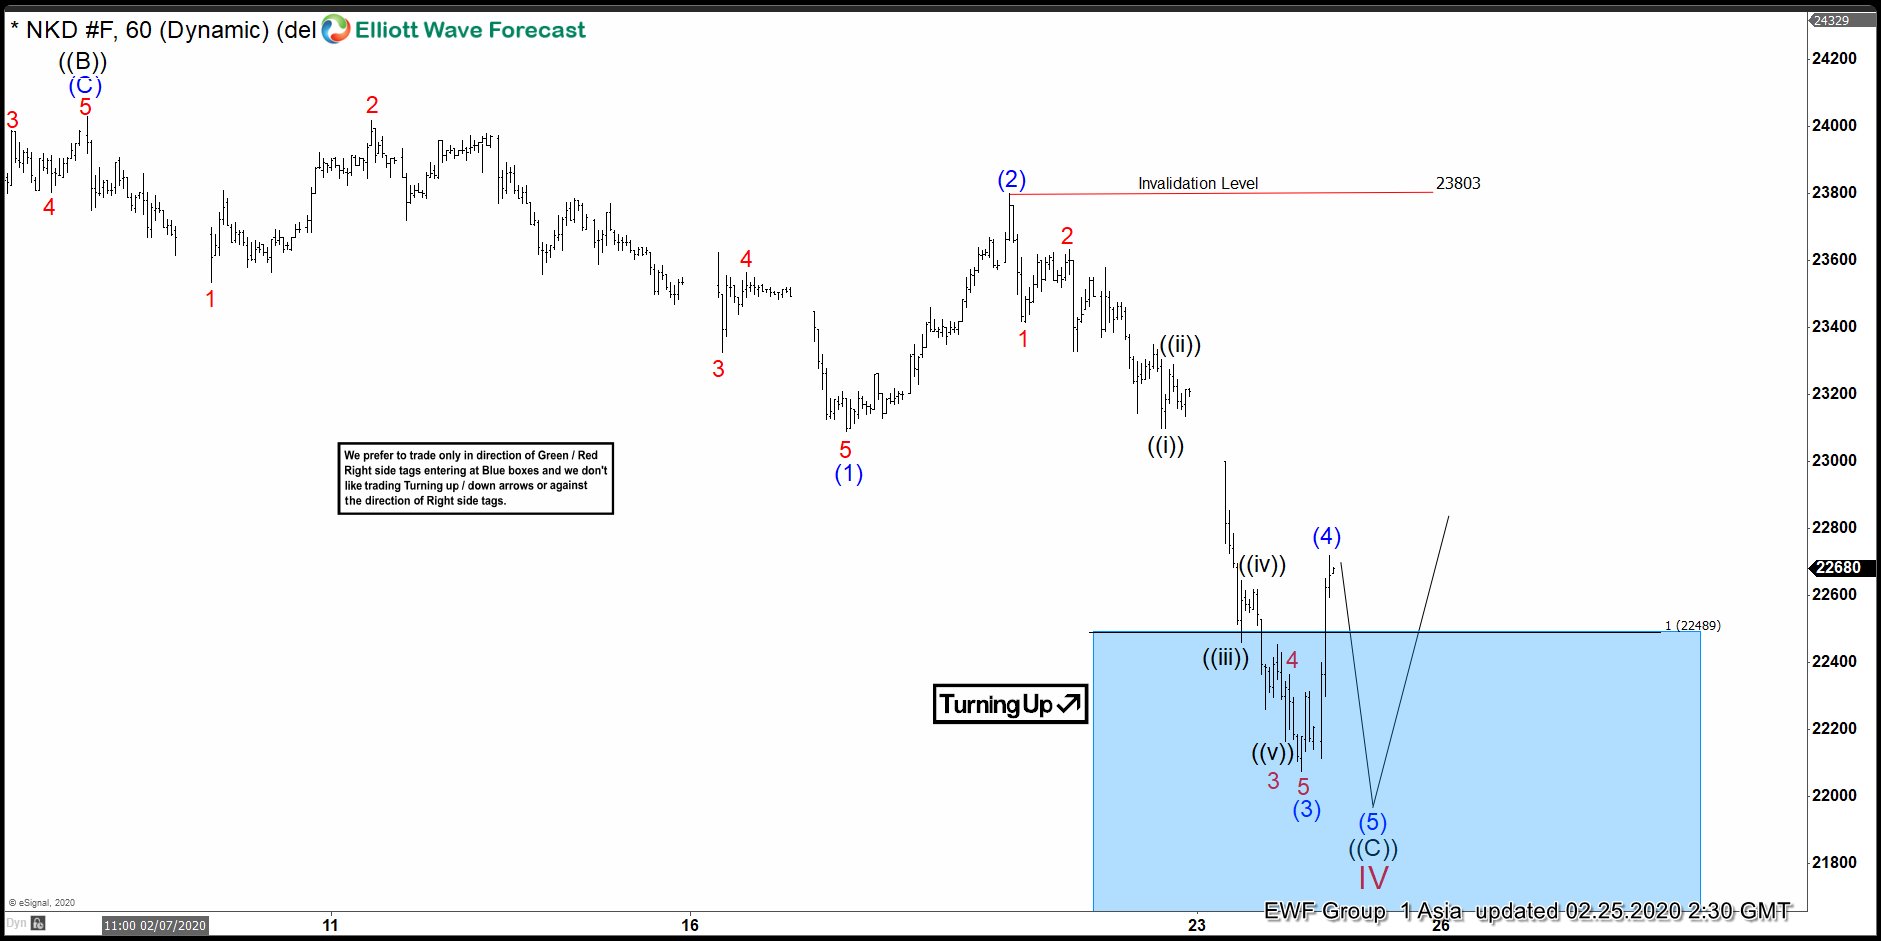
Short term Elliott wave view in Nikkei (NKD_F) suggests the Index is doing a larger degree pullback to correct the cycle up from August 26, 2019 low in wave IV, which is unfolding as a flat. Wave ((A)) of IV ended at 22630 low and wave ((B)) ended at 24030 high. From there, it has extended lower in wave ((C)), which is unfolding as a 5 waves impulse Elliott Wave structure. Down from wave ((B)) high, wave (1) ended at 23090 low. The bounce in wave (2) ended at 23803 high.
After that, the index extended lower in wave (3) which subdivides in lesser degree 5 waves. Wave 1 of (3) ended at 23415 low and wave 2 ended at 23635 high. The index continued lower in wave 3, which ended at 22165 low. Then, the bounce in wave 4 ended at 22365 high. The push lower in wave 5 of (3) ended at 22075 low. From there, the index then bounced in wave (4), which ended at 22735 high. Near term, the index has reached the 100% extension area from December 17, 2019 high between 21483-22489. However, expect another leg lower before the cycle from December 17 high ends in wave IV as long as 23803 pivot stays intact. Afterwards, the index should see a larger 3 waves bounce at least from the blue box area.
Nikkei (NKD_F) 1 Hour Elliott Wave Chart