
$SLV Ishares Silver Trust Larger Cycles and Elliott Wave
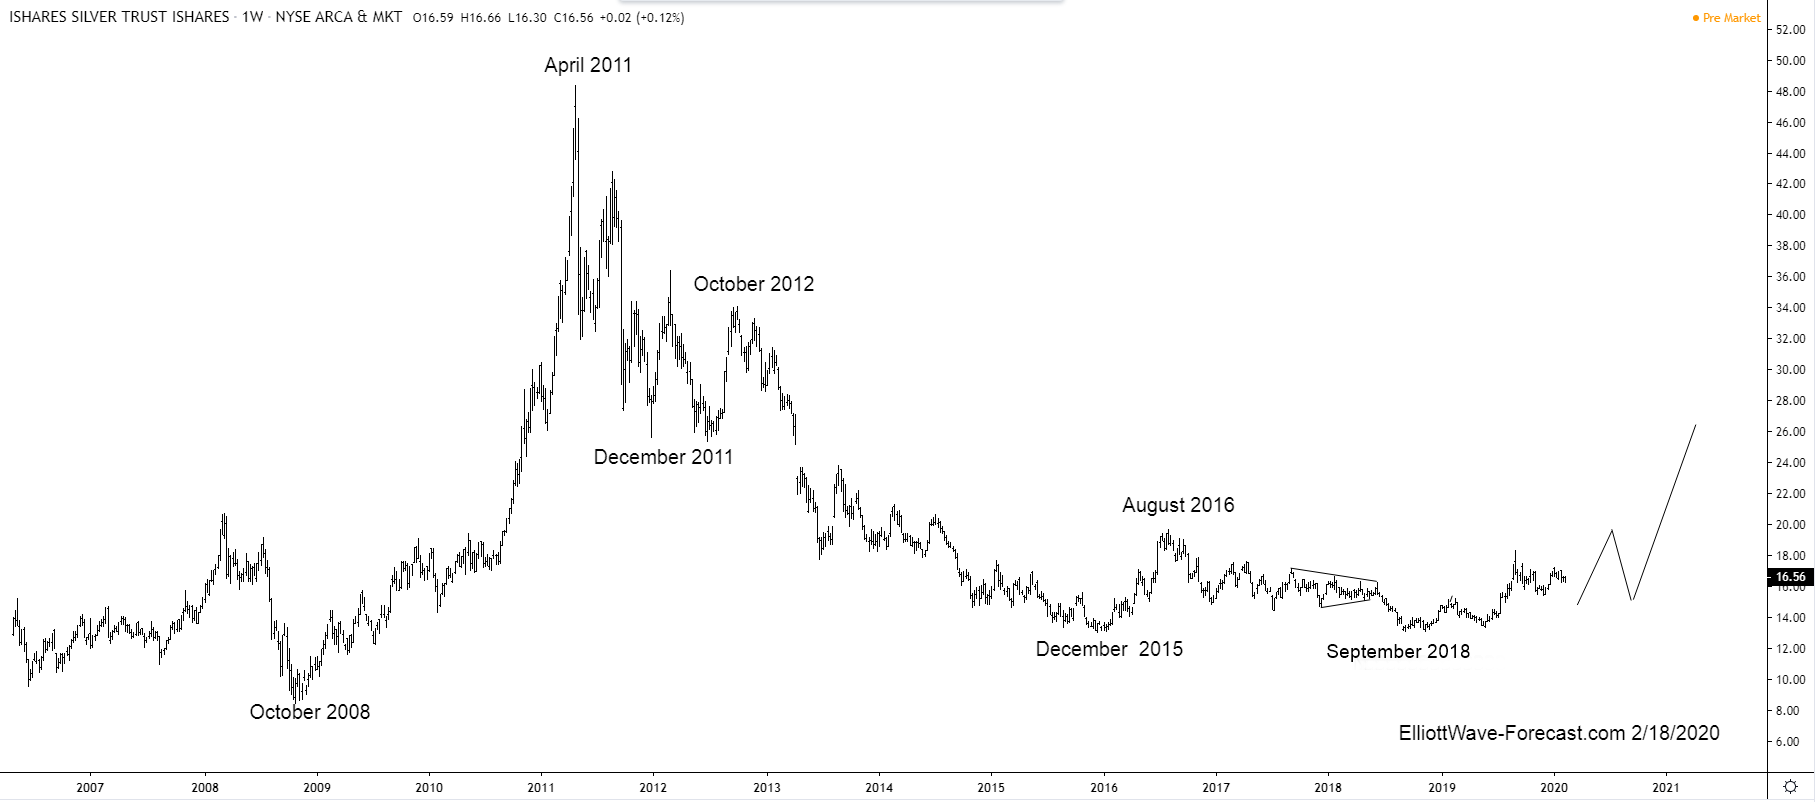
Firstly there is data back to when the ETF fund began in 2006 as seen on the weekly chart shown below. The fund made a low in 2008 that has not since been taken out in price. There is no Elliott Wave count on that weekly chart. However you should be able to assume from the October 2008 lows to the April 2011 highs was a larger degree impulse.
Secondly, the decline from the April 2011 highs down to the December 2015 lows was three swings. Price held above the October 2008 lows. The bounce from the December 2015 lows to the August 2016 high was strong enough to end the cycle from the April 2011 highs. I presume the correction lower completed there.
The analysis continues below the weekly chart.
Thirdly, the cycle from the April 2011 high appeared to have ended the bounce to the August 2016 high. That bounce appeared to be a diagonal wave one of large degree. This is where the daily chart shown below picks up with the Elliott Wave labeling. This decline appeared to be an Elliott Wave zig zag structure. The decline from the June 14, 2018 high ended on September 11th 2018 just above the lows from December 2015. Next, the bounce from the September 2018 lows was strong. It ended the cycle from the August 2016 highs.
The analysis concludes below the daily chart. Here is the SLV Daily Chart.
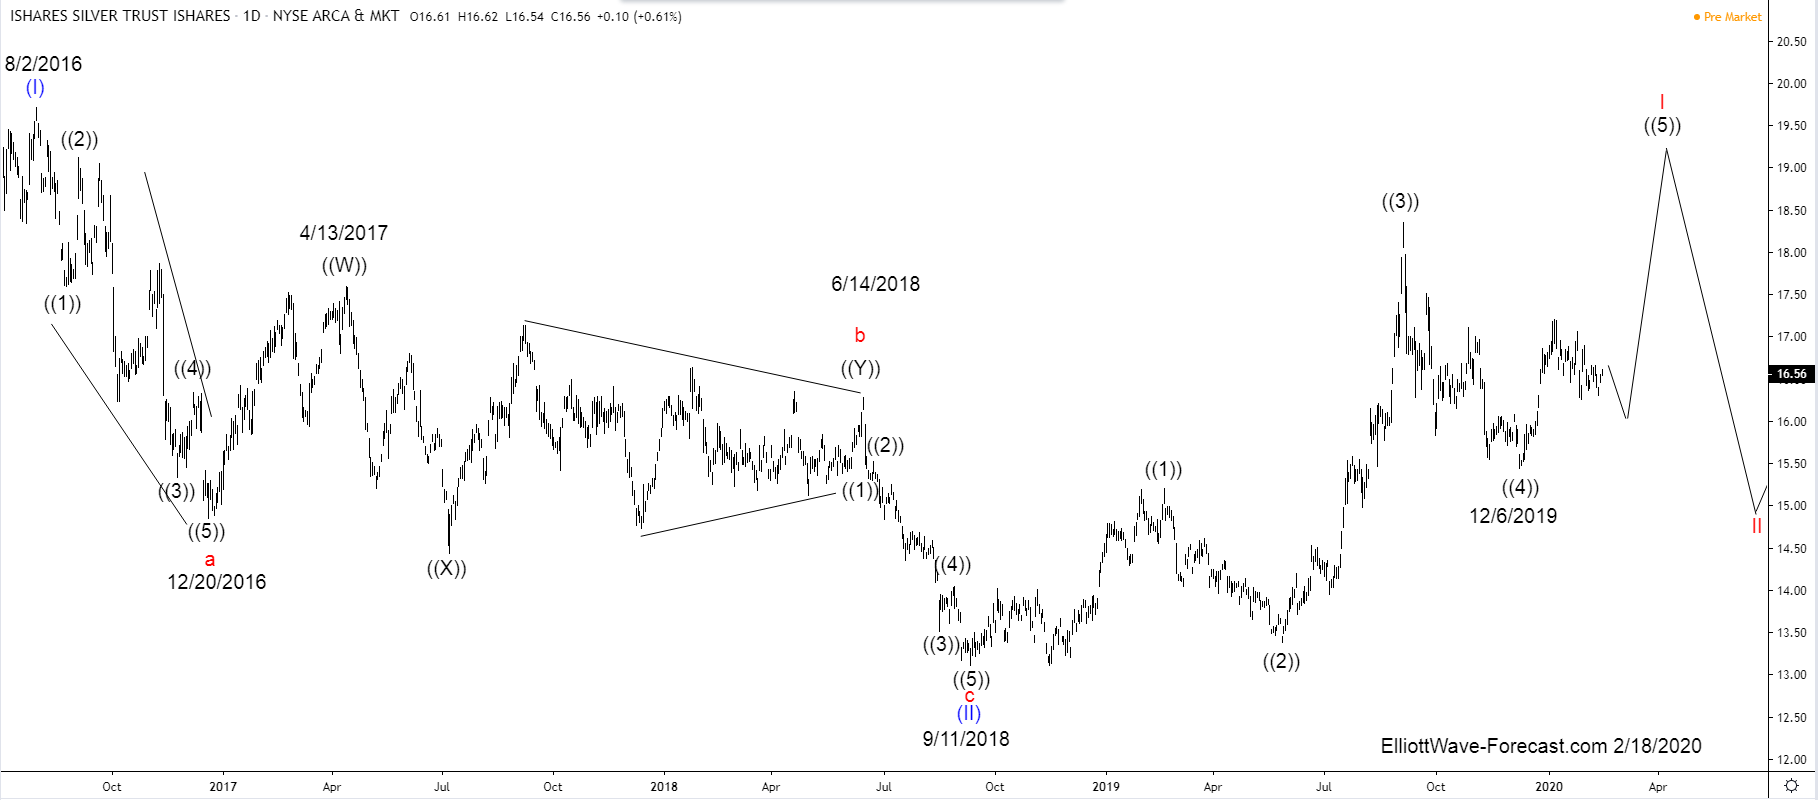
In conclusion, the bounce from the September 11, 2018 lows exhibits all qualities of an impulse. It is incomplete at this point. It should go higher once more above the 9/4/2019 highs. Most ways to get this fitth wave target have already been met. While above the December 2019 lows it can see strength to around the 19.00 area. Afterward it can correct the cycle up from the 9/11/2018 lows.