In this blog, we are going to take a look at the Elliottwave chart of EURCAD. Based on the daily chart shown below, the pair is doing a correction in wave IV right now. The correction is unfolding as a double three and has an incomplete sequence. It has not reached the 100% -161.8% extension at 1.3531 – 1.4368 area. We are showing this area with a blue box. The blue box is the area where we expect the correction to end and buyers to appear for an extension higher or 3 waves bounce at least.
EURCAD Incomplete Sequence from March 20,2018
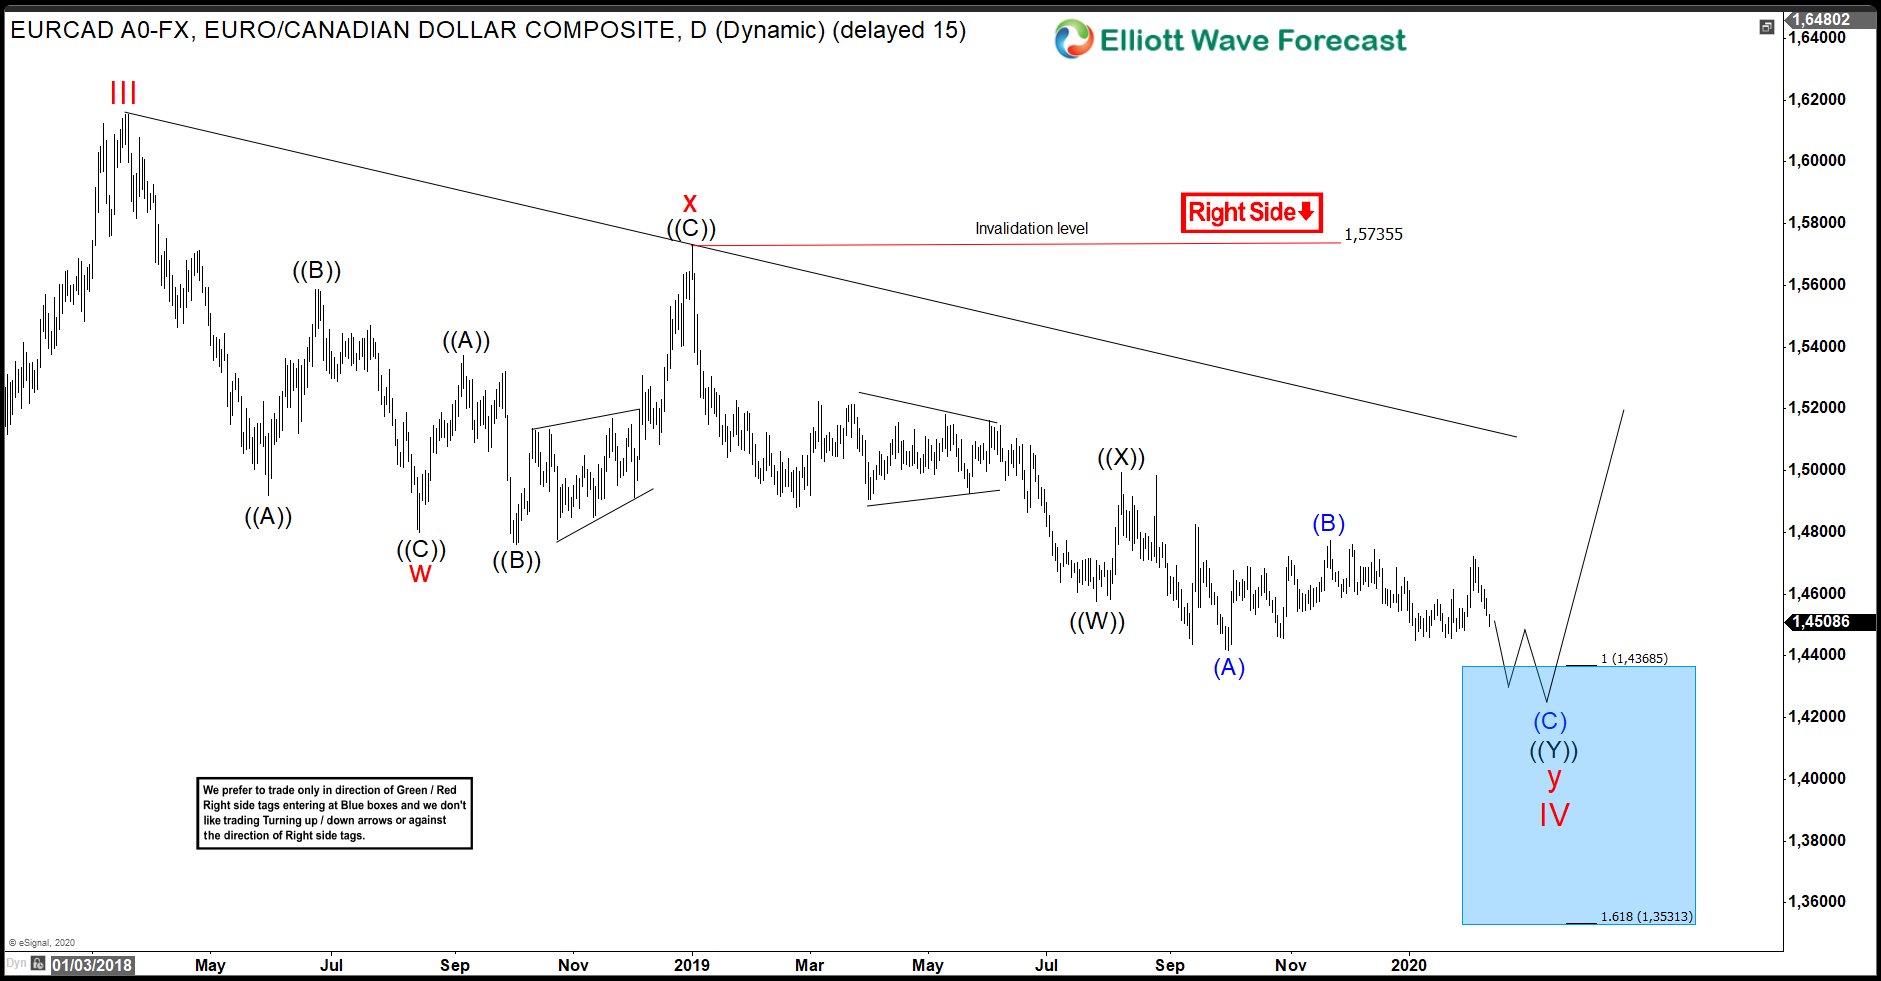
The daily chart shows that wave w of IV ended at 1.4795 low. The bounce in wave x ended at 1.5735 high. Currently, wave y is in progress. Wave ((W)) of y ended at 1.4575 low and wave ((X)) ended at 1.4995 high. Wave ((Y)) is unfolding as a zig-zag, where wave (A) ended at 1.4417 low and wave (B) ended at 1.4772 high. The pair can still extend lower as wave (C) remains in progress and has the scope to reach the blue box area. However, it needs to break below wave (A) low to confirm it.
EURCAD 2.3.2020 1 Hour NY Midday Elliott Wave Update
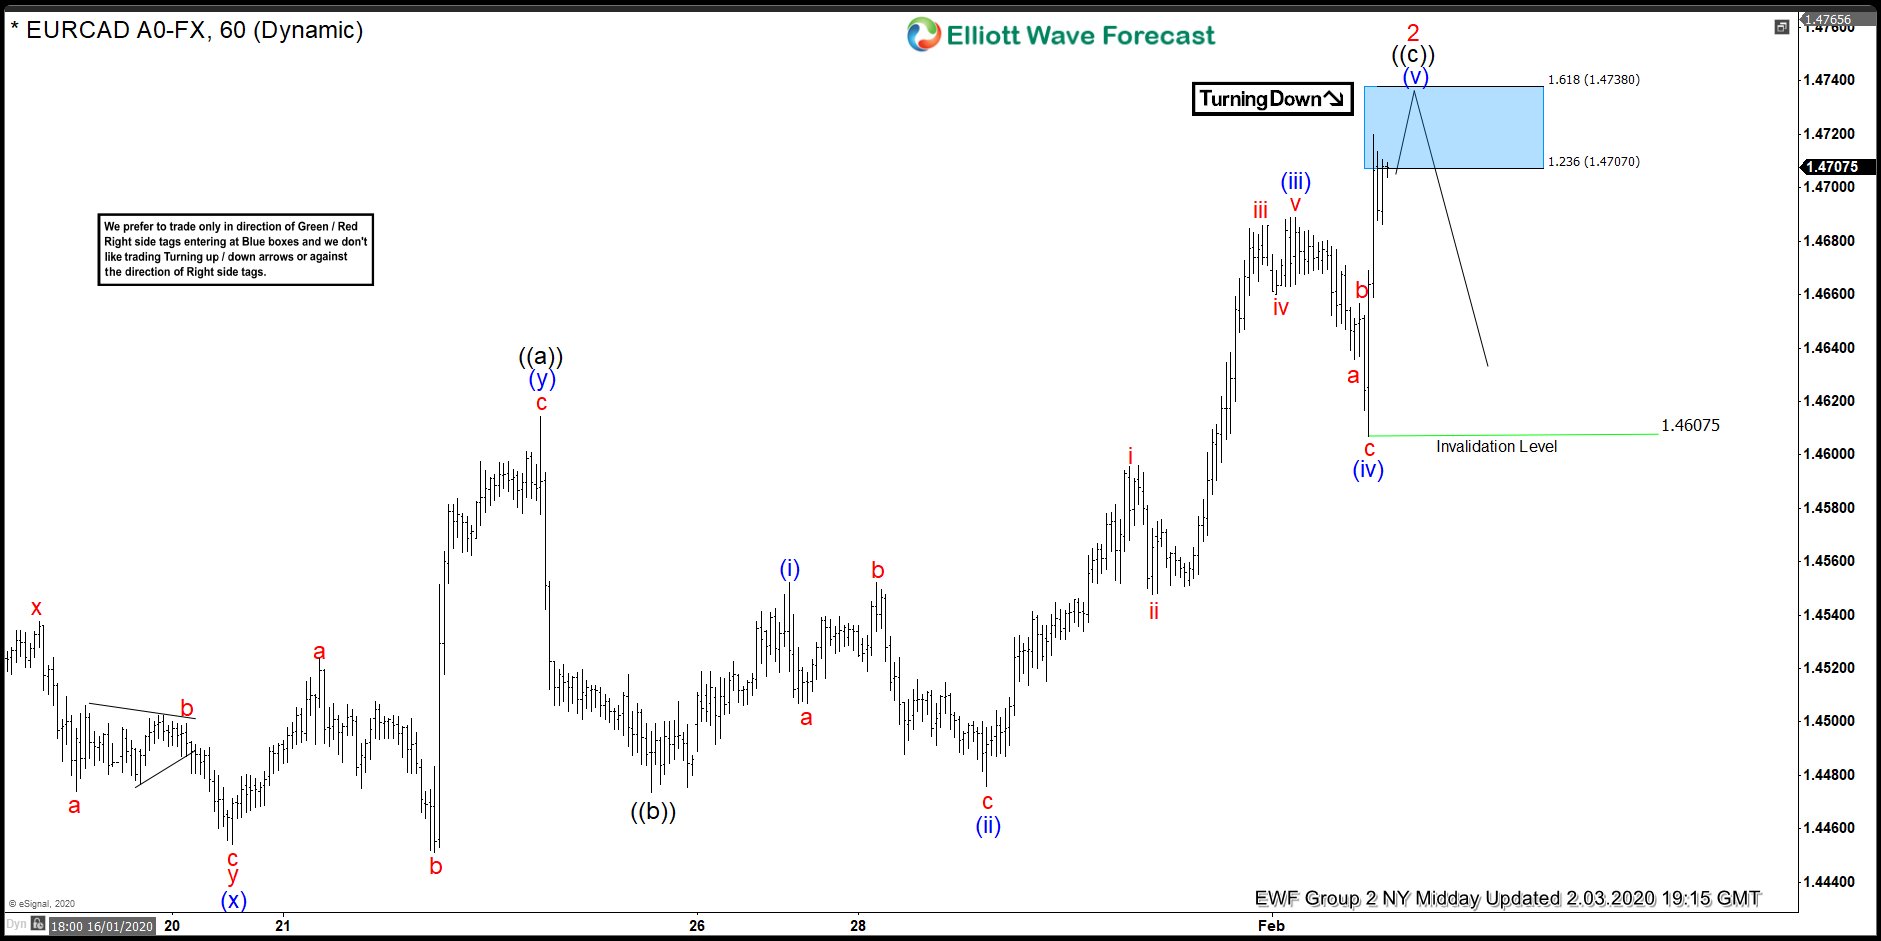
The chart from 2.3.2020 1 hour NY Midday update showed that wave 2 of (C) is unfolding as a zig-zag. Wave ((a)) ended at 1.4614 high and wave ((b)) ended at 1.4474 low. The 123.6% – 161.8% extension of wave ((a)) – ((b)) where wave ((c)) can end is at 1.4707-1.4738 area. The pair has already reached this blue box area. From there, we expected a 3 waves pullback at least or even an extension lower.
EURCAD 2.11.2020 1 Hour NY Elliott Wave Update
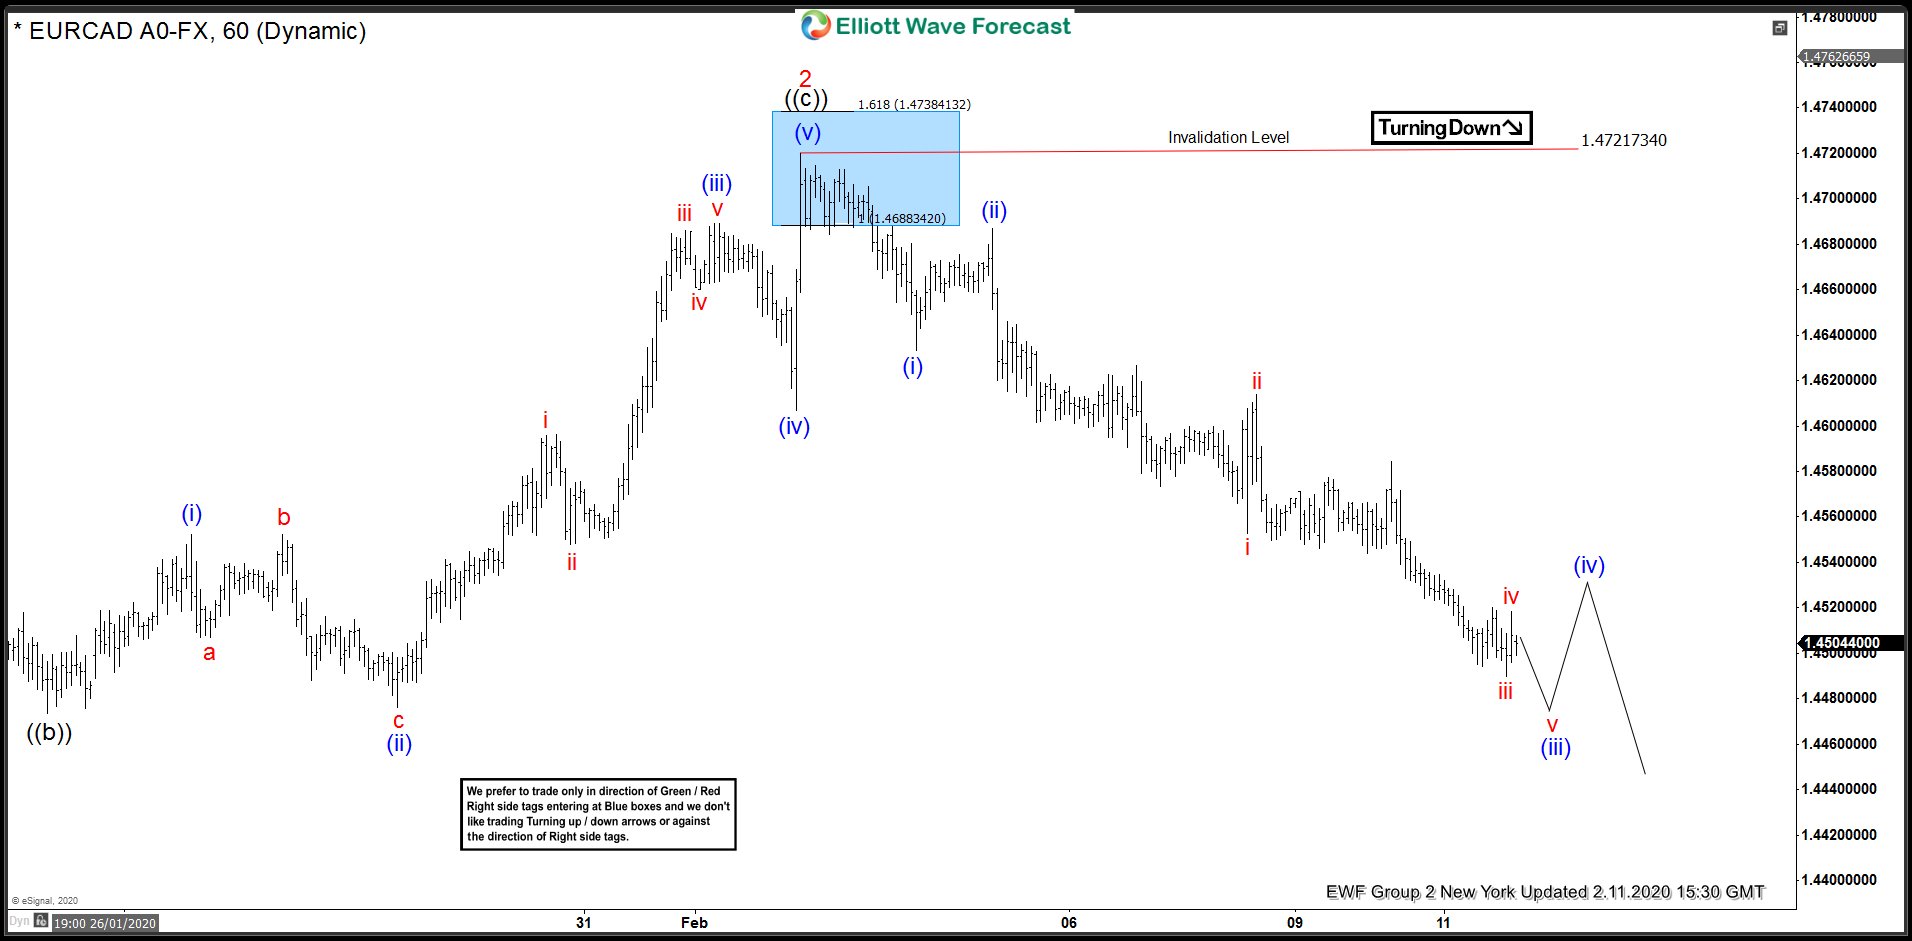
The chart from 2.11.2020 1 hour NY update showed that the pair has ended wave 2 at 1.4722 high, which is in the blue box area. From there, it has reacted lower, allowing members who sold at that area a risk free position. As long as the pivot at 1.4722 high stays intact, expect the bounce in 3,7,11 swings to fail. The pair then can continue to extend lower until it reaches the blue box area in the daily chart.