
In this blog, we are going to take a look at the Elliottwave chart of AUDJPY. The rally from August 26, 2019 unfolded as 5 waves impulsive move up in wave (A) as a leading diagonal. Based on Elliottwave theory, the impulsive move up will be followed by 3 waves correction before extending higher. Therefore, we were expecting to buy at the extreme area. We showed this area with a blue box. The blue box is the area where we expect buyers to appear for an extension higher or 3 waves bounce at least.
AUDJPY 1.27.2020 4 Hour Elliott Wave Update
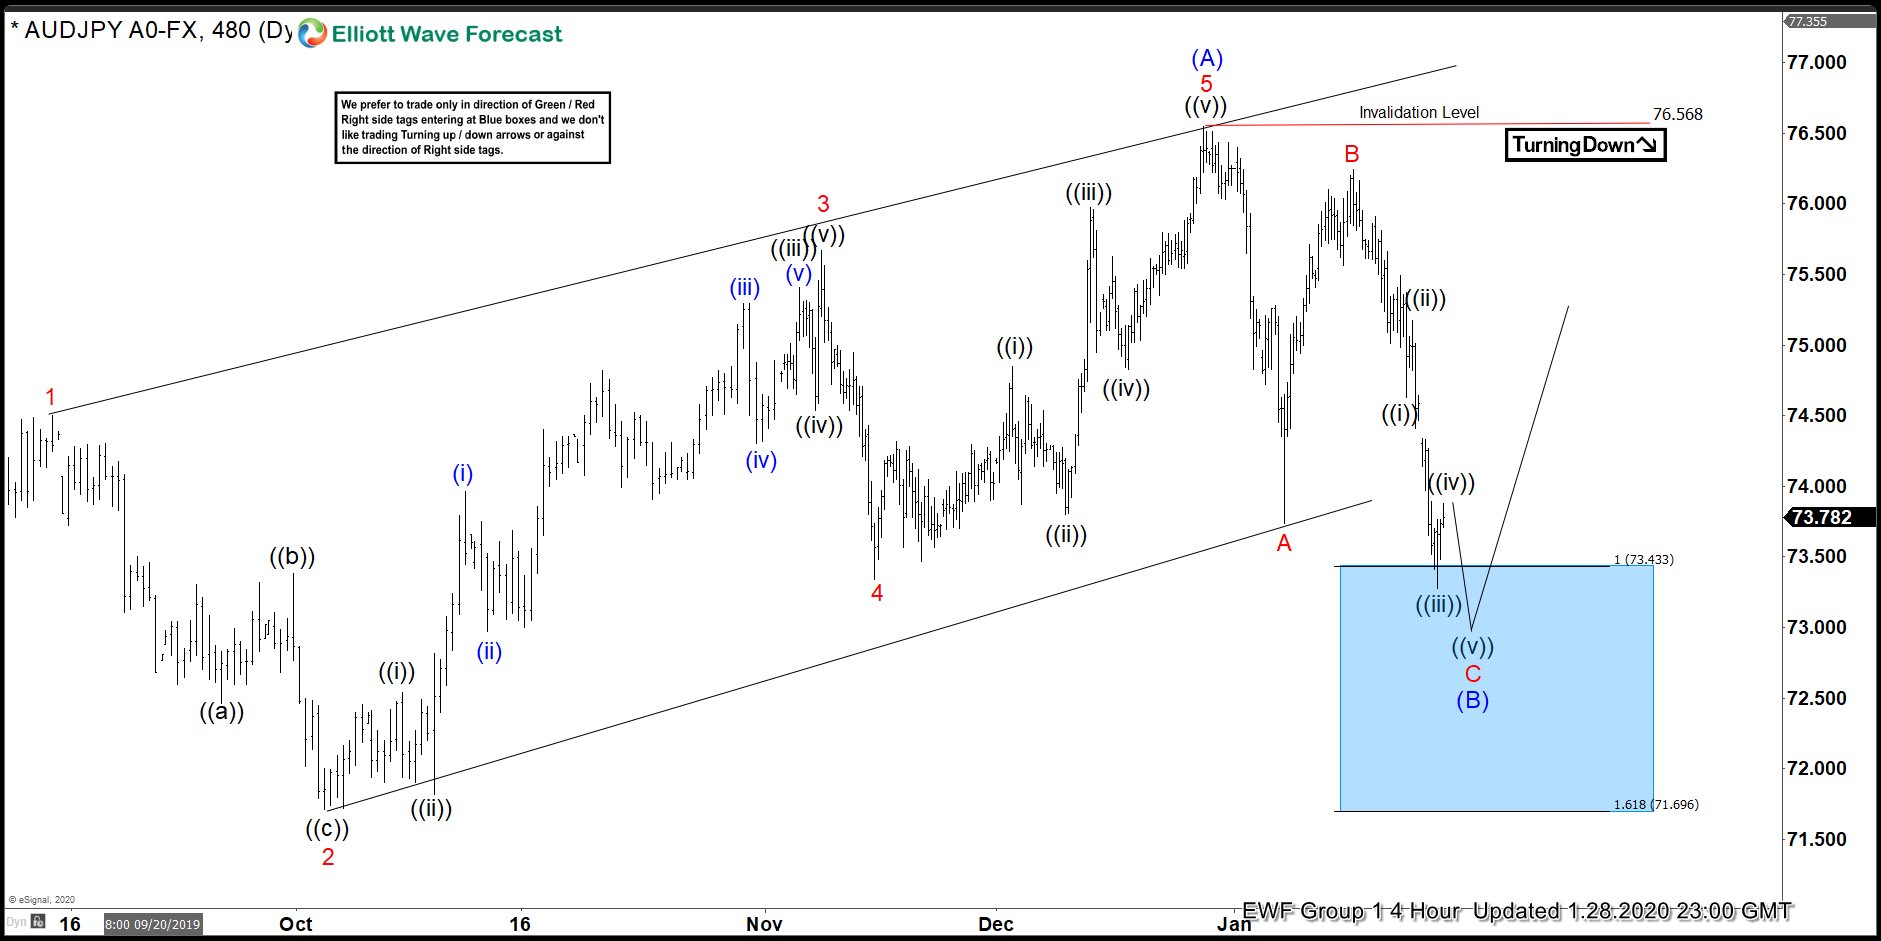
The chart from 1.28.2020 4 hour update showed that AUDJPY ended wave (A) at 76.57 high. While below that high, we expect the bounce in 3,7,11 swings to fail. The 3 waves correction unfolded as a zig-zag. Wave A of (B) ended at 73.76 low and wave B of (B) ended at 76.25 high. From there, we expect AUDJPY to continue to extend lower in wave C of (B). The 100%-161.8% Fibonacci extension of A – B where wave C can end is between 71.70-73.43 area. The pair has already reached this area. However, we were expecting another push lower as the subwave of C is still missing another leg lower.
AUDJPY 2.6.2020 4 Hour Elliott Wave Update
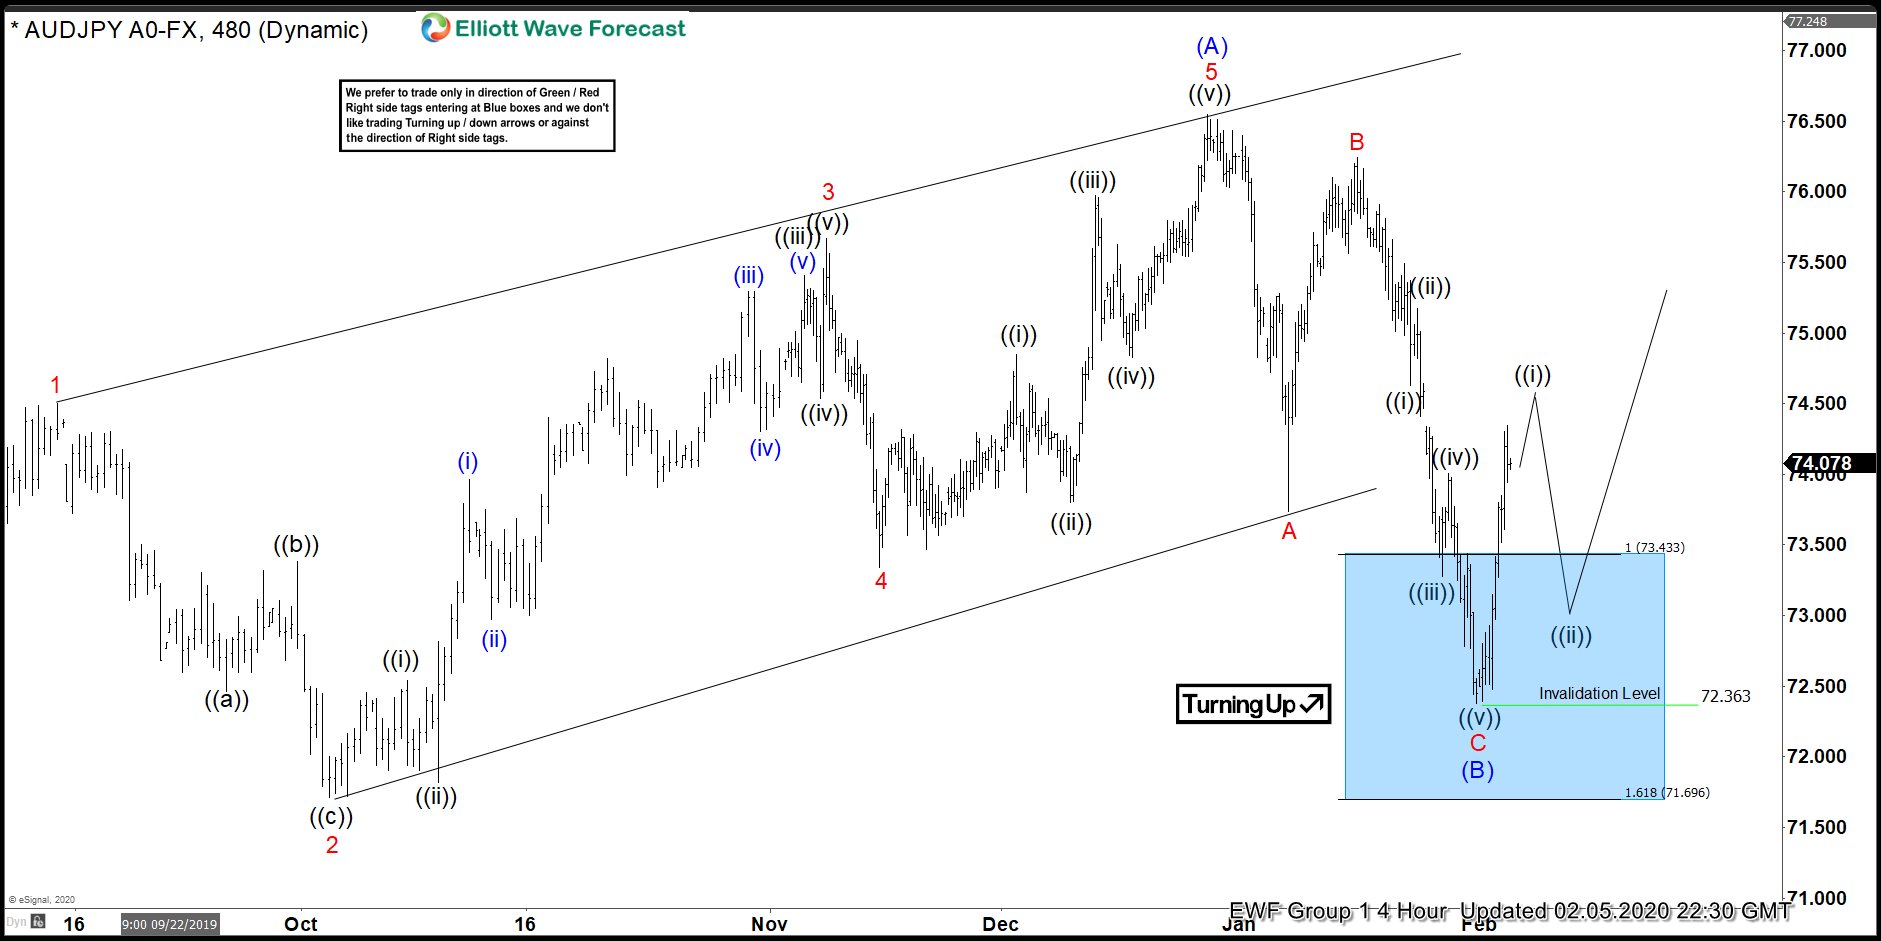
The chart from 2.5.2020 4 hour update showed that AUDJPY pushed lower and ended wave (B) at 72.36 low. The pair has bounced higher from there. As long as the pivot at 72.36 stays intact, the pair can continue to extend higher in wave (C). However, the pair needs to break above wave (A) high at 76.57 to confirm the extension higher and to avoid doing a double correction.