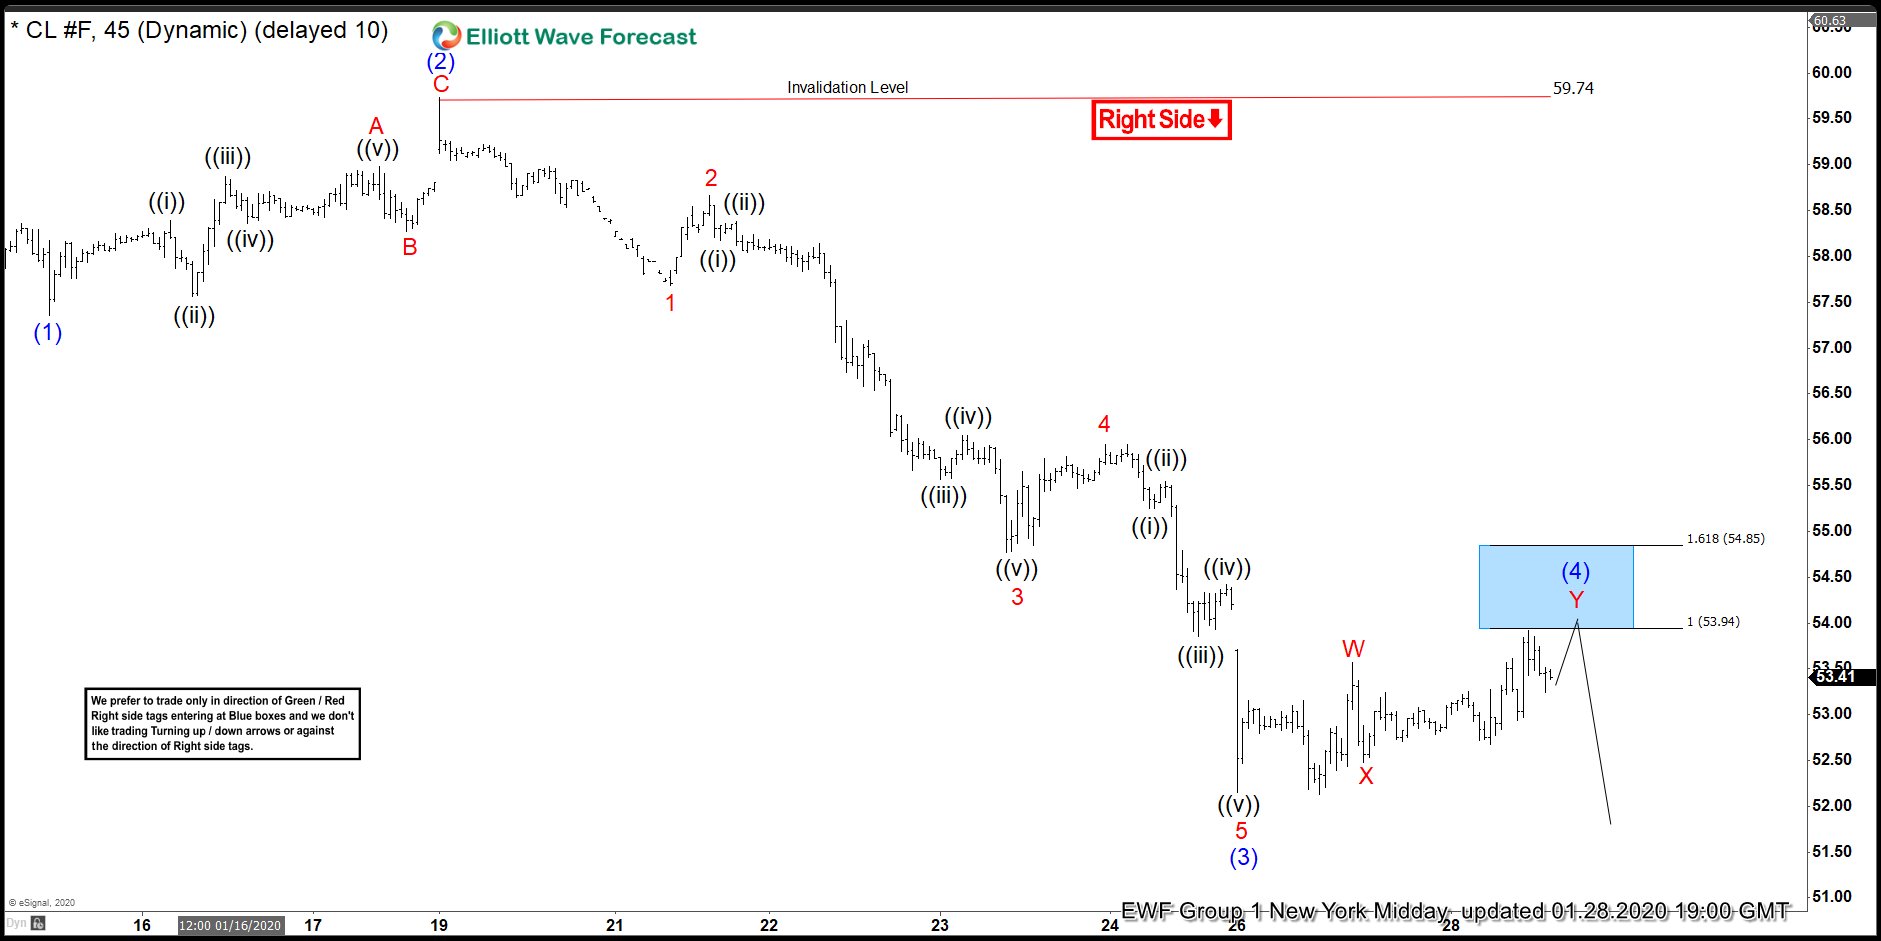
In this blog, we are going to take a quick look at the Elliottwave chart of Oil (CL_F). Oil is proposed to be in wave ((C)) which we expect to unfold as a 5 waves move down. The chart from 1.28.2020 New York Midday update showed that Oil has ended wave (3) at 52.15 low. It then bounced in wave (4) as a double correction. Wave W of (4) ended at 53.57 high. Wave X of (4) ended at 52.48 low. From there, we expect Oil to bounce higher to complete wave Y of (4). The 100%-161.8% Fibonacci extension of W – X where wave Y can end is between 53.94-54.85 area. We highlighted this area with a blue box. The blue box area is the area where we expect sellers to appear for an extension lower or 3 waves pullback at least.
CL_F 1.28.2020 1 Hour New York Midday Elliott Wave Update
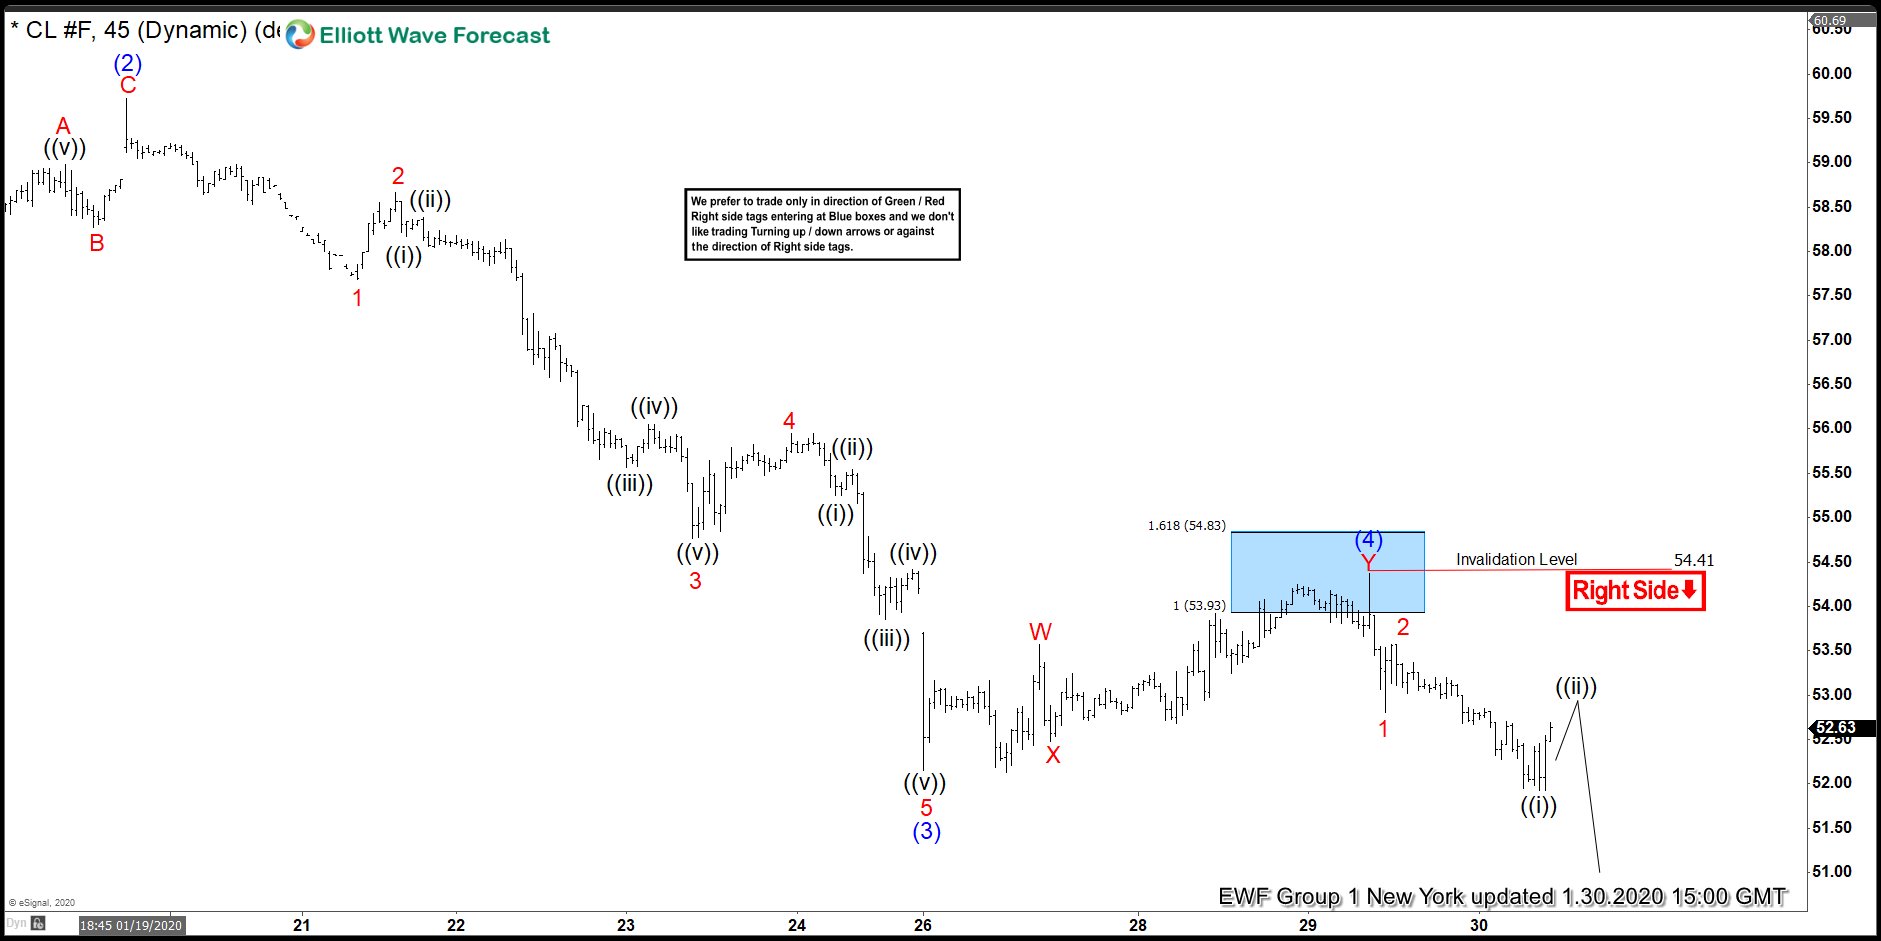
The chart below from 1.30.2020 New York update shows that wave (4) ended at 54.41 high, which is in the blue box area. Afterwards, the price has extended lower and allowed members who sold at the blue box area a risk free trade. The move down broke below wave (3) low, which confirmed that wave (5) is now in progress. As long as wave (4) high at 54.41 stays intact, we expect oil to continue to extend lower to complete wave (5).
CL_F 1.30.2020 1 Hour New York Elliott Wave Update
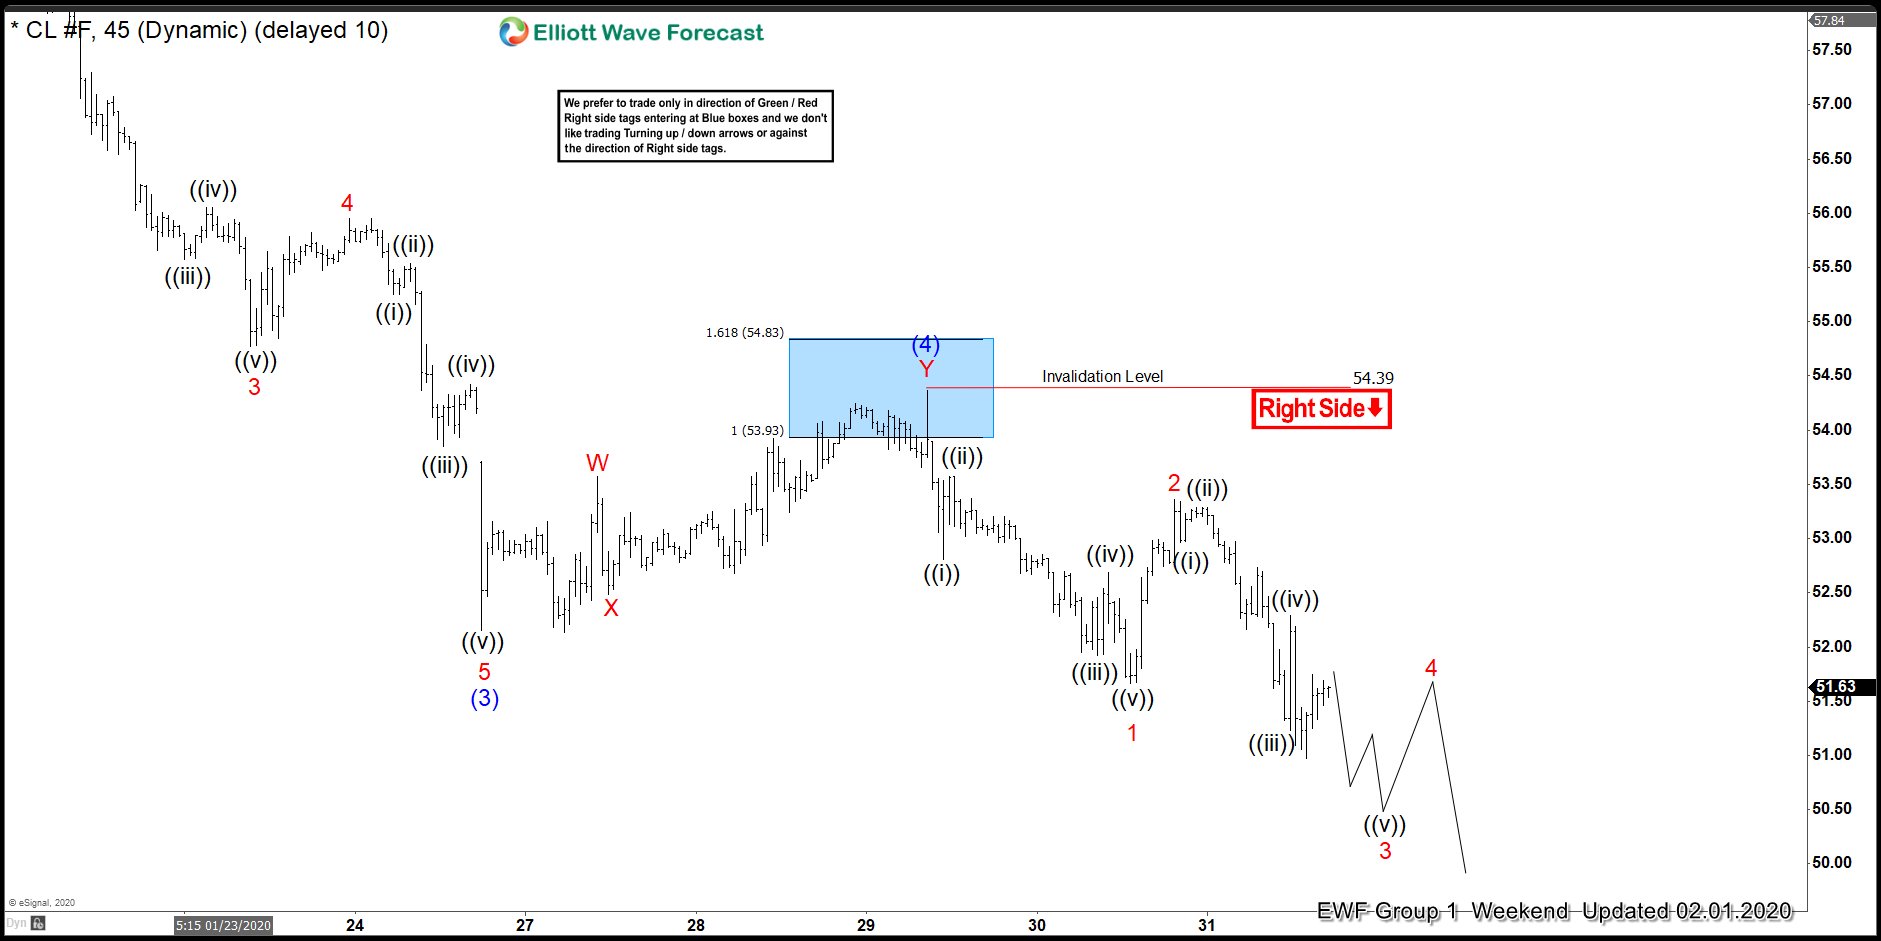
In the latest weekend update from 2.1.2020, Oil continue to extend lower. We also adjusted the count. Wave 1 of (5) now ended at 51.66 low and wave 2 of (5) ended at 53.36 high. Wave 3 of (5) is now in progress. Once it has ended, oil should see a bounce in wave 4. While below 54.41 high, the bounce in 3,7,11 swings is expected to fail. Oil then should see another leg lower to complete the 5 wave move down in wave ((C)).
CL_F 2.1.2020 1 Hour Weekend Elliott Wave Update