Hello fellow traders. In this technical blog we’re going to take a quick look at the Elliott Wave charts of SUGAR ( $SB_F ) published in members area of the Elliottwave-Forecast.com . As our members know, SUGAR is showing incomplete sequences in the cycle from the September 12th low (10.68). Break above 2nd October peak made higher high sequences in proposed cycle. Consequently we’ve been calling for further extension higher . The Commodity Futures is targeting 14.32 + area within the proposed cycle. Recently we got 3 waves pull back , when the price reached Blue Box- Buyers zone. The Commodity found buyers there as we expected. In further text we’re going to explain Elliott Wave Forecast and trading strategy.
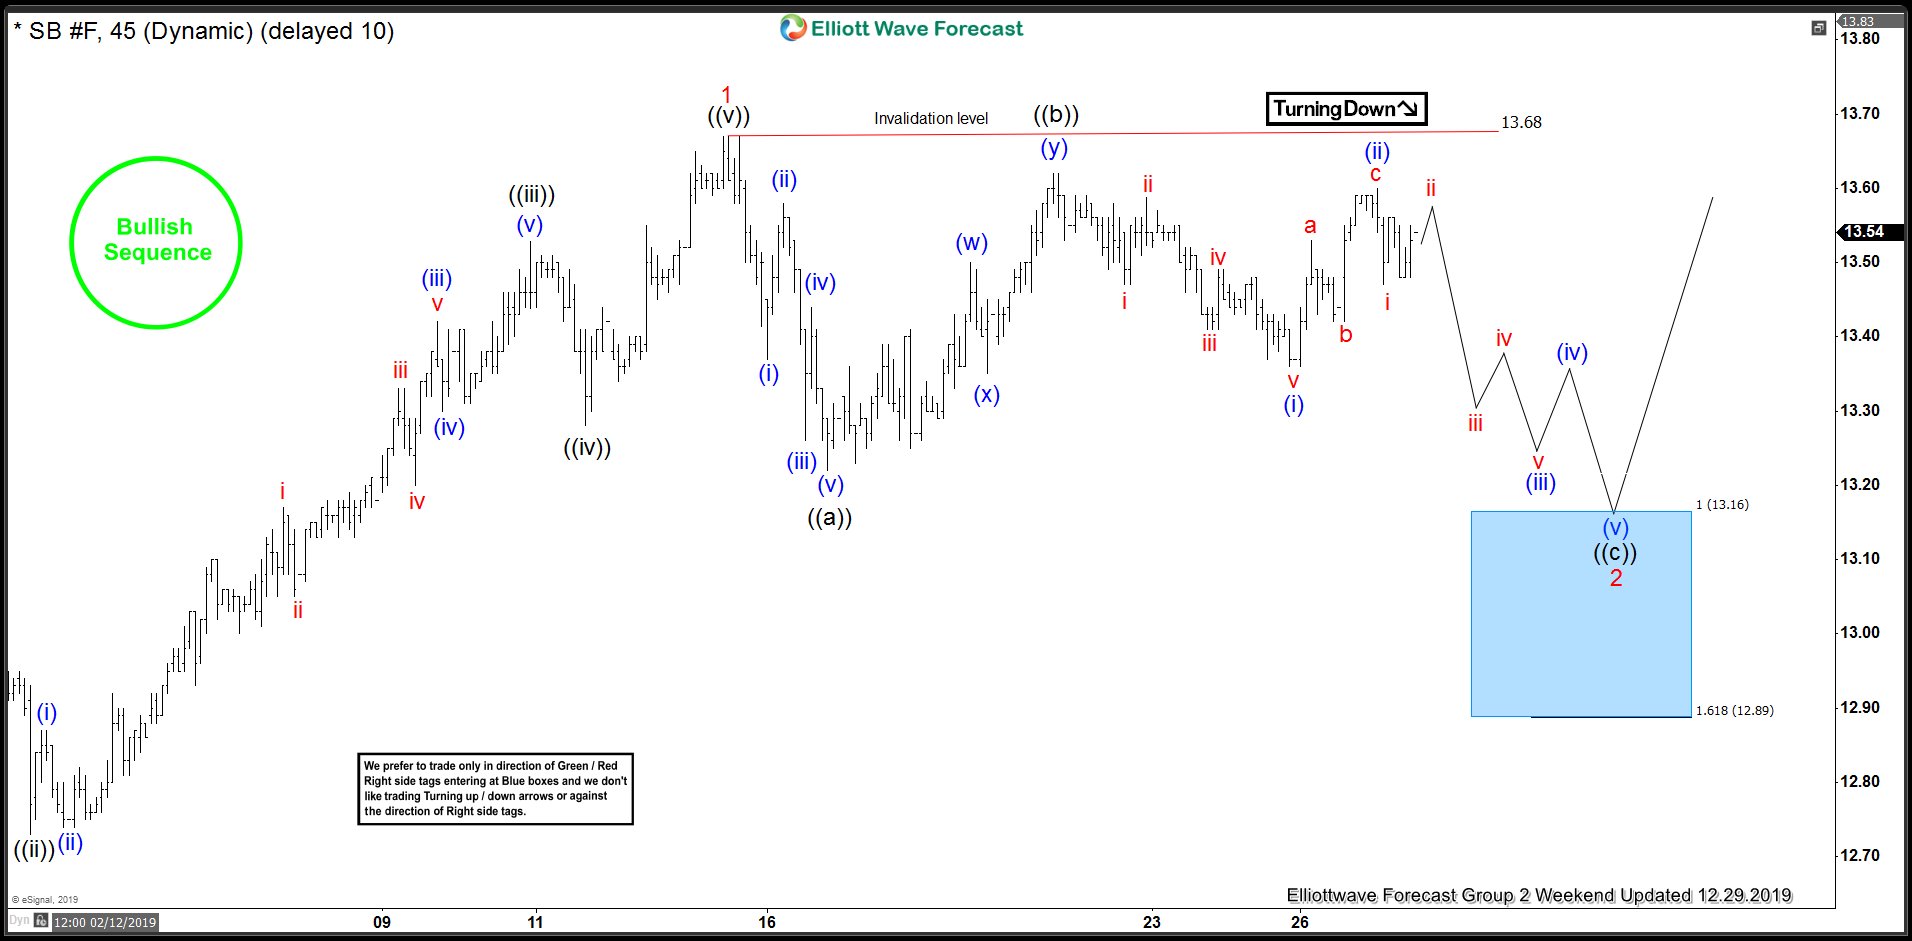
SUGAR 1 Hour Elliott Wave Analysis 12.29.2019
Current view suggests SUGAR is giving us correction against the 12.05 low. Proposed pull back is unfolding as Elliott Wave Zig Zag pattern, when we can be now in ((c)) leg down toward 13.16-12.89 area . As far as the price stays below 13.68 high, we can get another leg down toward Blue Box area:13.16-12.89 ( buyers zone). Although we are calling for proposed decline, we don’t recommend selling the commodity against the main bullish trend. Strategy is waiting for Blue Box to be reached. At that area we would like to be buyers for proposed rally.
As our members know, Blue Boxes are no enemy areas , giving us 85% chance to get a bounce. The main trend is bullish and we expect to see reaction in 3 waves up from the blue box at least. Invalidation level for the long trade would be break below 1.618 Fib extension:12.89.
You can learn more about Elliott Wave Zig Zag Patterns at our Free Elliott Wave Educational Web Page.
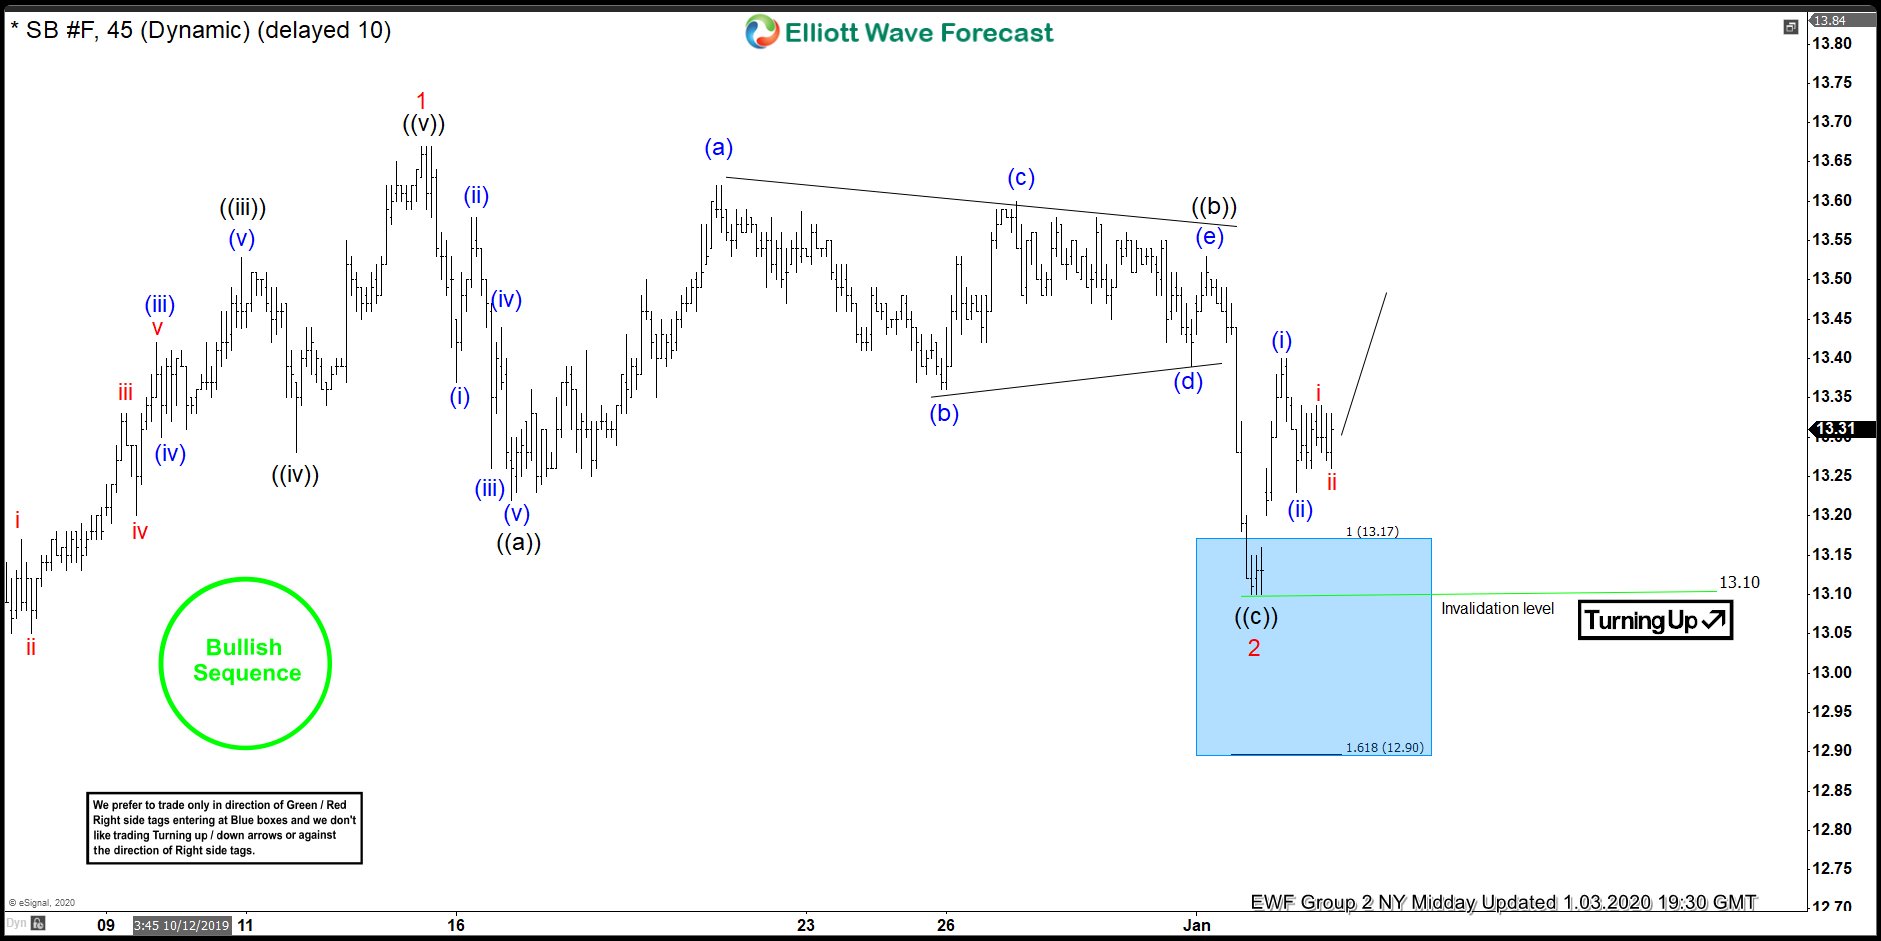
SUGAR 1 Hour Elliott Wave Analysis 1.03.2020
SUGAR has been trading sideways in short term. Eventually , the commodity gave us proposed leg down toward blue box. It found buyers right at the blue box area : 13.16-12.89 . At this stage we are calling pull back completed at the 13.10 low as Elliott Wave Zig Zag. However, we need to see break above 13th December peak to get confirmation next leg up is in progress. Until that happens we should be aware that 13.1 low is more vulnerable and we don’t recommended buying short term dips against that level. Members who took long trades should be already risk free.
Keep in mind market is dynamic and presented view could have changed in the mean time. You can check most recent charts in the membership area of the site. Best instruments to trade are those having incomplete bullish or bearish swings sequences.We put them in Sequence Report and best among them are shown in the Live Trading Room.