In this technical blog we’re going to take a quick look at the Elliott Wave charts of AUDUSD published in the membership area of the elliottwave-forecast . As our members know, AUDUSD recently gave us rally within the short term cycle from the 11/29 low . We got 3 waves pull back , that unfolded as Elliott Wave Double Three Pattern. The pair reached Equal Legs – Blue Box and found buyers at that area as we expected. In further text we’re going to explain the forecast and Elliott Wave Pattern.
Before we take a look at the real market example, let’s explain Elliott Wave Double Three pattern.
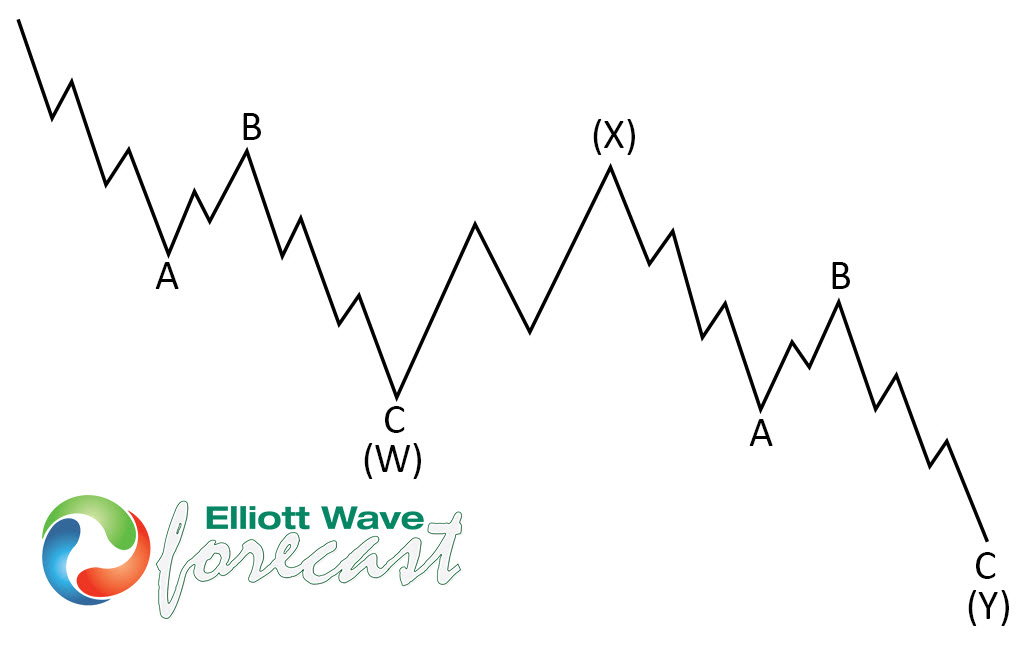
Elliott Wave Double Three Pattern
Double three is one of the most common pattern in the market these days, also known as 7 swing structure. It’s a very reliable pattern which is giving us good trading entries with clearly defined invalidation levels and target areas.The picture below presents what Elliott Wave Double Three pattern looks like. It has (W),(X),(Y) labeling and 3,3,3 inner structure, which means all of these 3 legs are corrective sequences. Each (W) and (Y) are made of 3 swings , they’re having A,B,C structure in lower degree.
You can learn more about Elliott Wave Double Three Patterns at our Free Elliott Wave Educational Web Page.
AUDUSD1 Hour Elliott Wave Analysis 12.10.2019
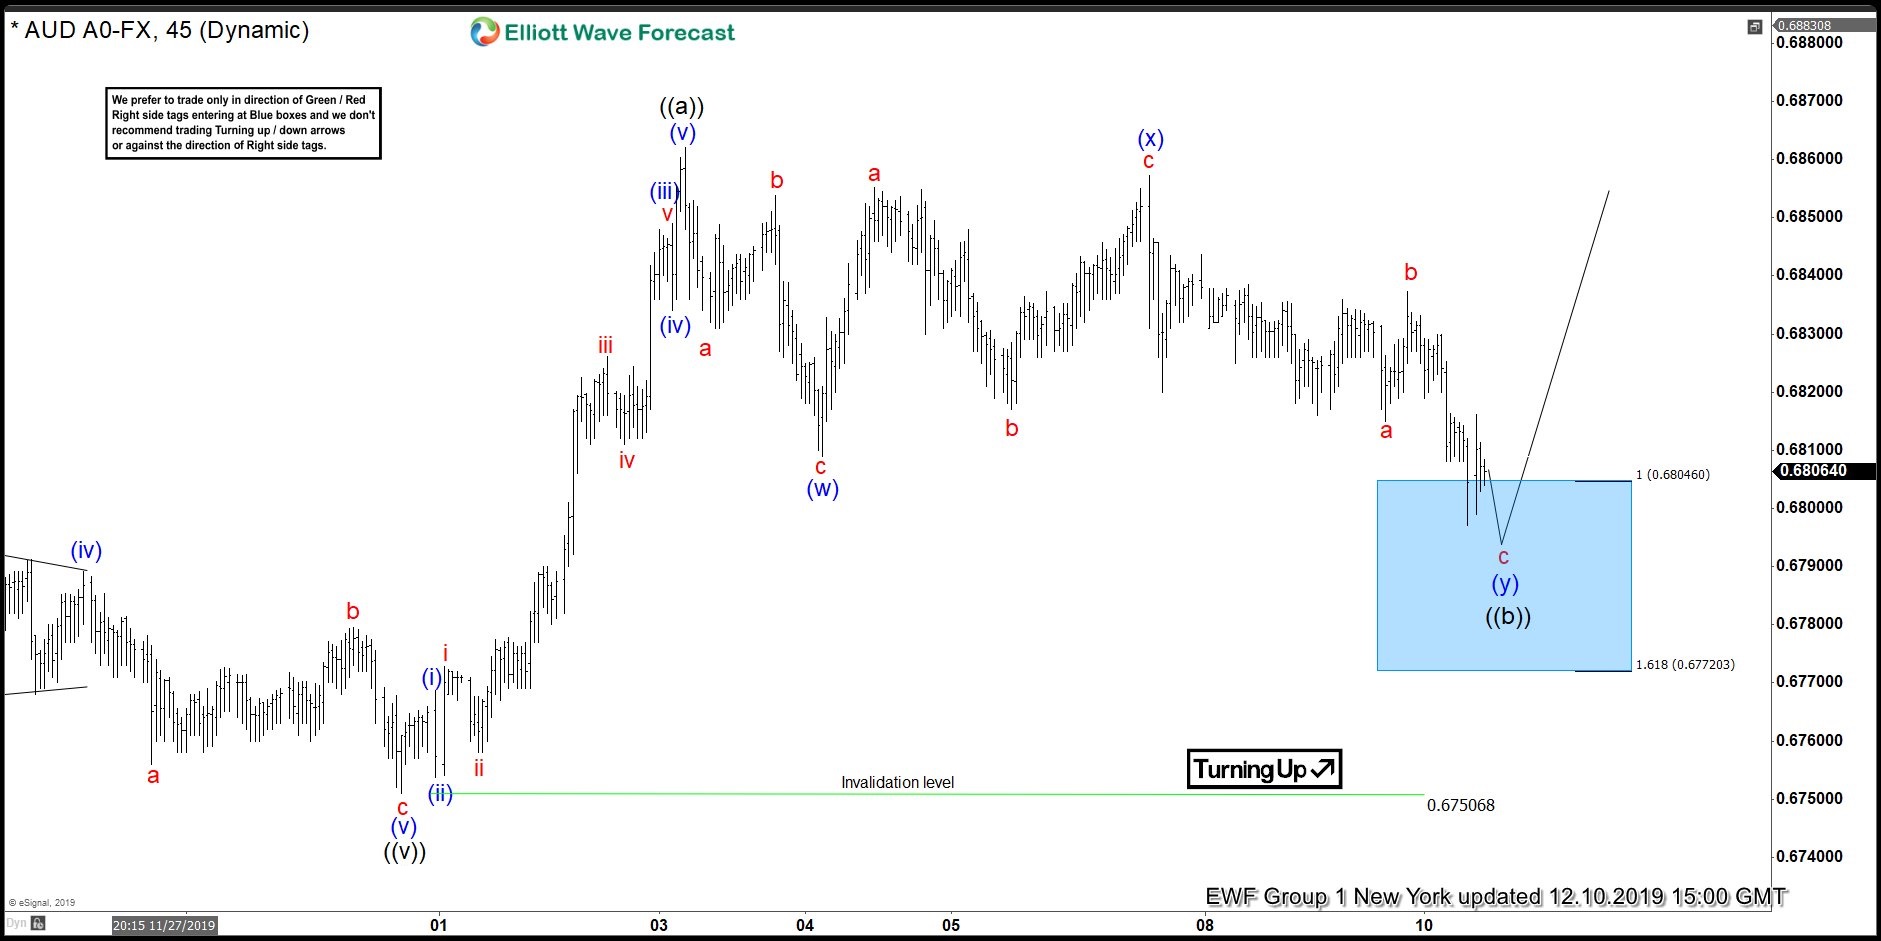
AUDUSD is correcting the short term cycle cycle from the 22427 low. The pull back is unfolding as Elliott Wave Double Three Pattern. At this stage we can count clear 7 swings down from the peak when the price has already reached the equal legs- Blue Box area. There is no any clear sign yet that pull back is done, but we are aware that turn can happen any moment . We expected buyers to appear at the blue box for a proposed rally or 3 waves bounce alternatively. We don’t recommend selling the pair and expect rally to happen from the blue box in 3 waves bounce at least.
As our members know, Blue Boxes are no enemy areas , giving us 85% chance to get a reaction from there.
AUDUSD1 Hour Elliott Wave Analysis 12.10.2019
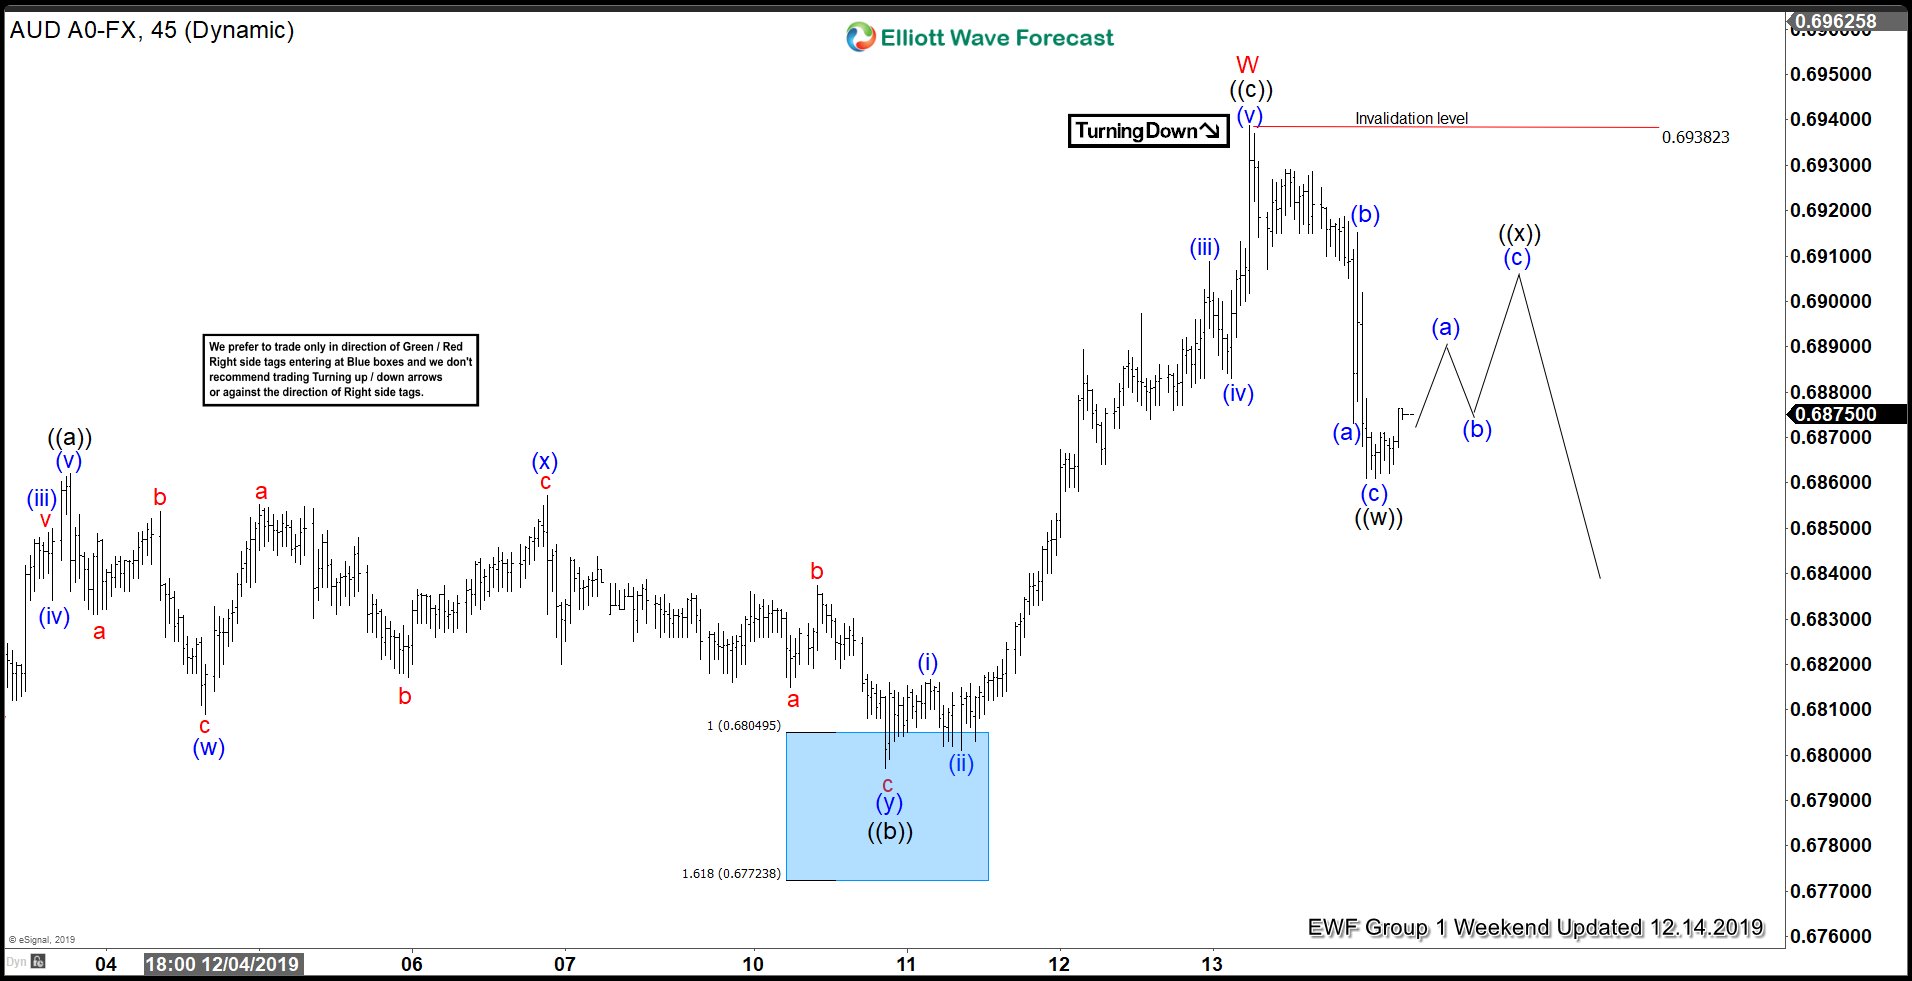
AUDUSD found buyers right at the blue box area . We got nice impulsive rally when the price made break above 10/31 peak. That suggests further extension higher as far as pivot at 0.67523 low holds. At this stage we are calling cycle from the 11/29 low completed as wave W red. As far as the price stays below 0.693823 peak, we can get another leg down before buyers appear again.
Keep in mind market is dynamic and presented view could have changed in the mean time. You can check most recent charts in the membership area of the site. Best instruments to trade are those having incomplete bullish or bearish swings sequences.We put them in Sequence Report and best among them are shown in the Live Trading Room.