CADJPY Technical Analysis November 14/2019
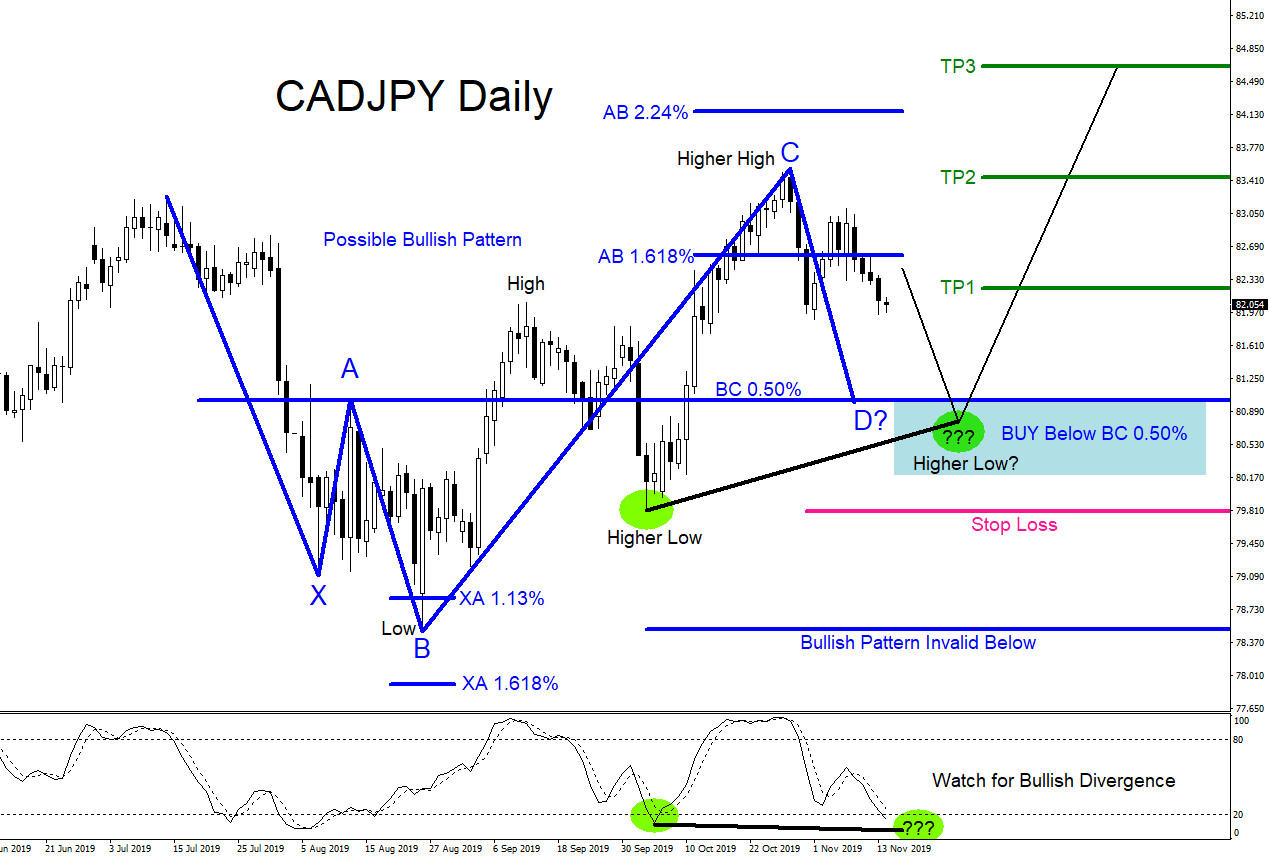
CADJPY : A possible bullish pattern is visible on the Daily time frame. The blue bullish pattern still needs to make a push lower to complete point D at the BC 0.50% Fib. retracement level where CADJPY can possibly bounce higher from. If price extends higher above the AB 2.24% Fib. level before reaching the BC 0.50% Fib. level then the bullish pattern is invalid and BUY setup is cancelled. If looking to trade CADJPY traders should be patient and wait for price to make a move lower towards the minimum BC 0.50% Fib. retracement level. Waiting for price to hit the BC 0.50% Fib. retracement minimum will offer a better risk/reward trade setup. Traders will also need to watch if indicator and price forms a visible bullish divergence. A bullish divergence will add more confirmation that the pair can reverse and bounce higher. Blue bullish pattern is invalidated if price moves below point B of the pattern but for this BUY trade setup Stop Loss will be placed at the previous Higher Low (79.81). A break below this level stops the Higher High/Higher Low sequence and will signal for more possible downside. If price bounces higher then watch for green target levels to hit. We remain bullish for now and we expect for the pair to extend higher towards the 84.50 area.
CADJPY Daily Chart 11.14.2019
Of course, like any strategy/technique, there will be times when the strategy/technique fails so proper money/risk management should always be used on every trade.