Bank Of America (NYSE: BAC) recovered 50% of the 2008 financial crisis crash while majority of banks already rallied back to new all time highs. The stock is still showing positive signs as the rallies taking place since 2009 low are unfolding as an Elliott Wave impulsive structure.
BAC recent daily rally from 2016 low was an impulsive 5 waves advance which ended on March 2018 peak. Down from there, the stock entered a consolidation period of time to correct the previous cycle before it can resume the main bullish trend.
The decline from $33 peak was a corrective 3 swings move which ended on December 2018 before the stock started bouncing again without making new highs. The overall shape of the moves during the recent 2 years formed an inverted head and shoulder pattern which usually appear at the end of a bearish trend to indicate a reversal. However, it can also be used as a continuation pattern within a bullish trend which can be the case for BAC as long as it remains above $22.6 low.
BAC Weekly Chart
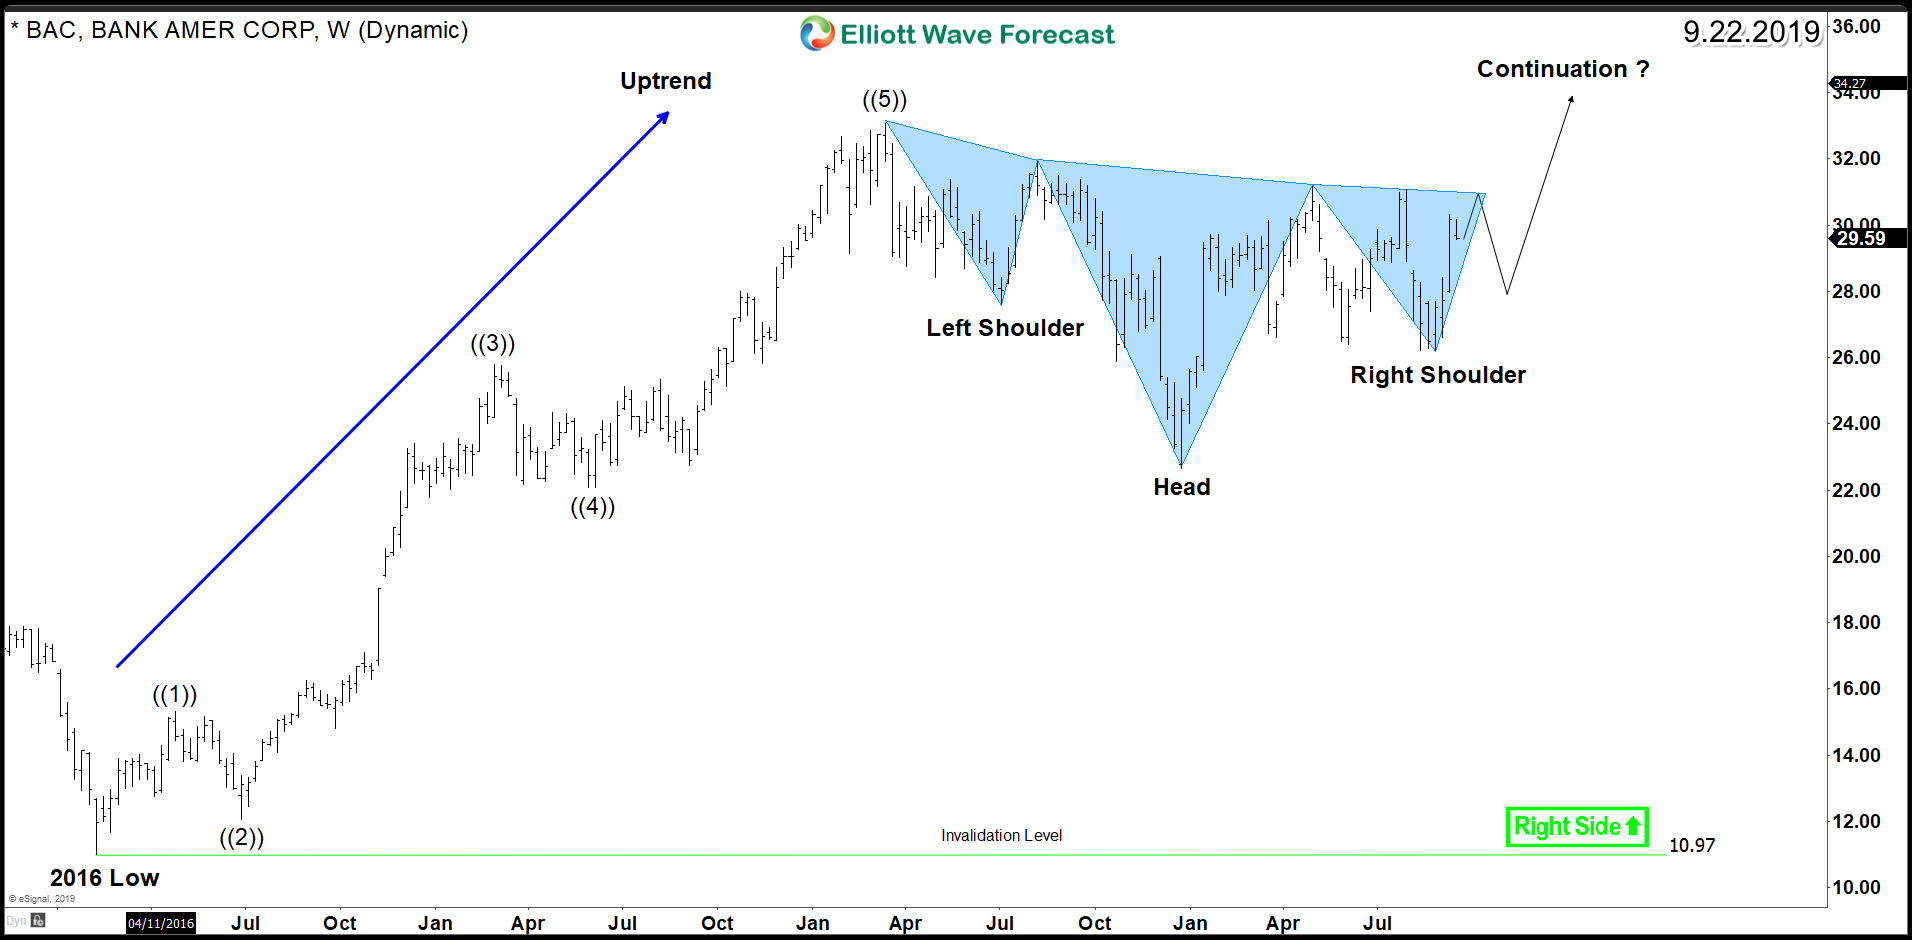
The inverted head and shoulder pattern needs a conformation with a clear breakout of its neckline and ideally taking the previous peak to open a higher high sequence indicating the resumption of the trend. Consequently, BAC needs an initial break above April 2019 peak $31 followed by a break above $33 to open a new incomplete bullish sequence and aim for a target higher around $36 – $39 area.
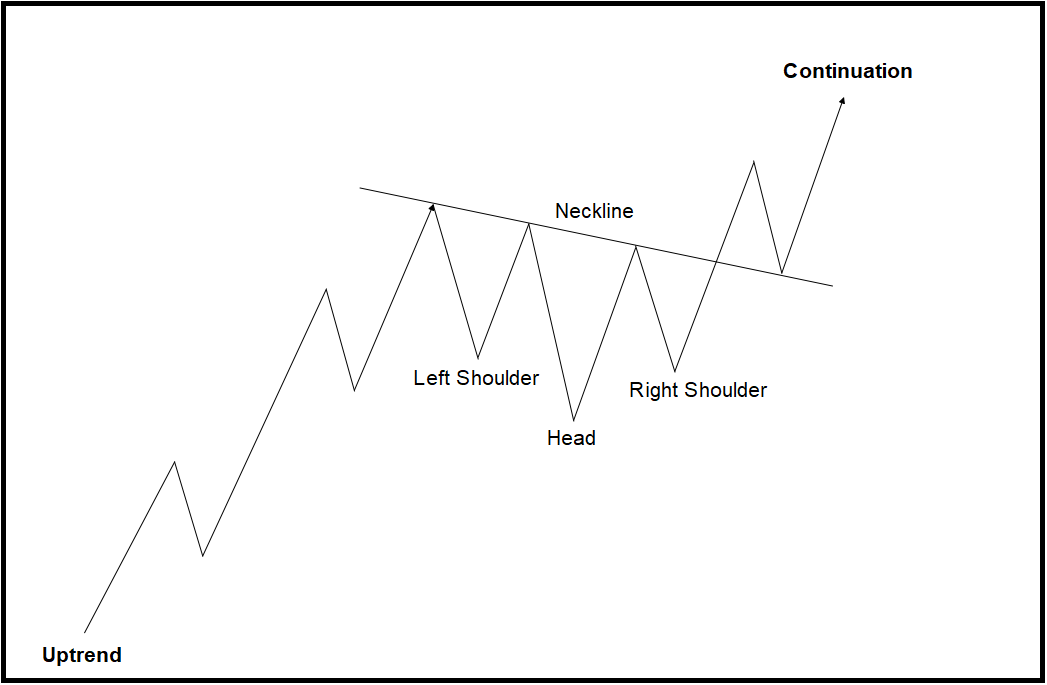
Inverted Head & Shoulder Pattern