
UUP Bullish Cycles from May 2011 lows
Firstly the dollar tracking ETF fund UUP inception date was 2/20/2007. Interestingly the dollar index has a low in March 2008. The UUP ETF fund shows a low in May 2011. The dollar index did make a pullback cycle low in May 2011 however it was well above the March 2008 lows. The bullish cycle up from the May 2011 lows in UUP is the focus of this analysis where it begins on the weekly chart. It should see some further upside before any larger size pullbacks relative to the longer term cycles.
The analysis continues below the UUP weekly chart.
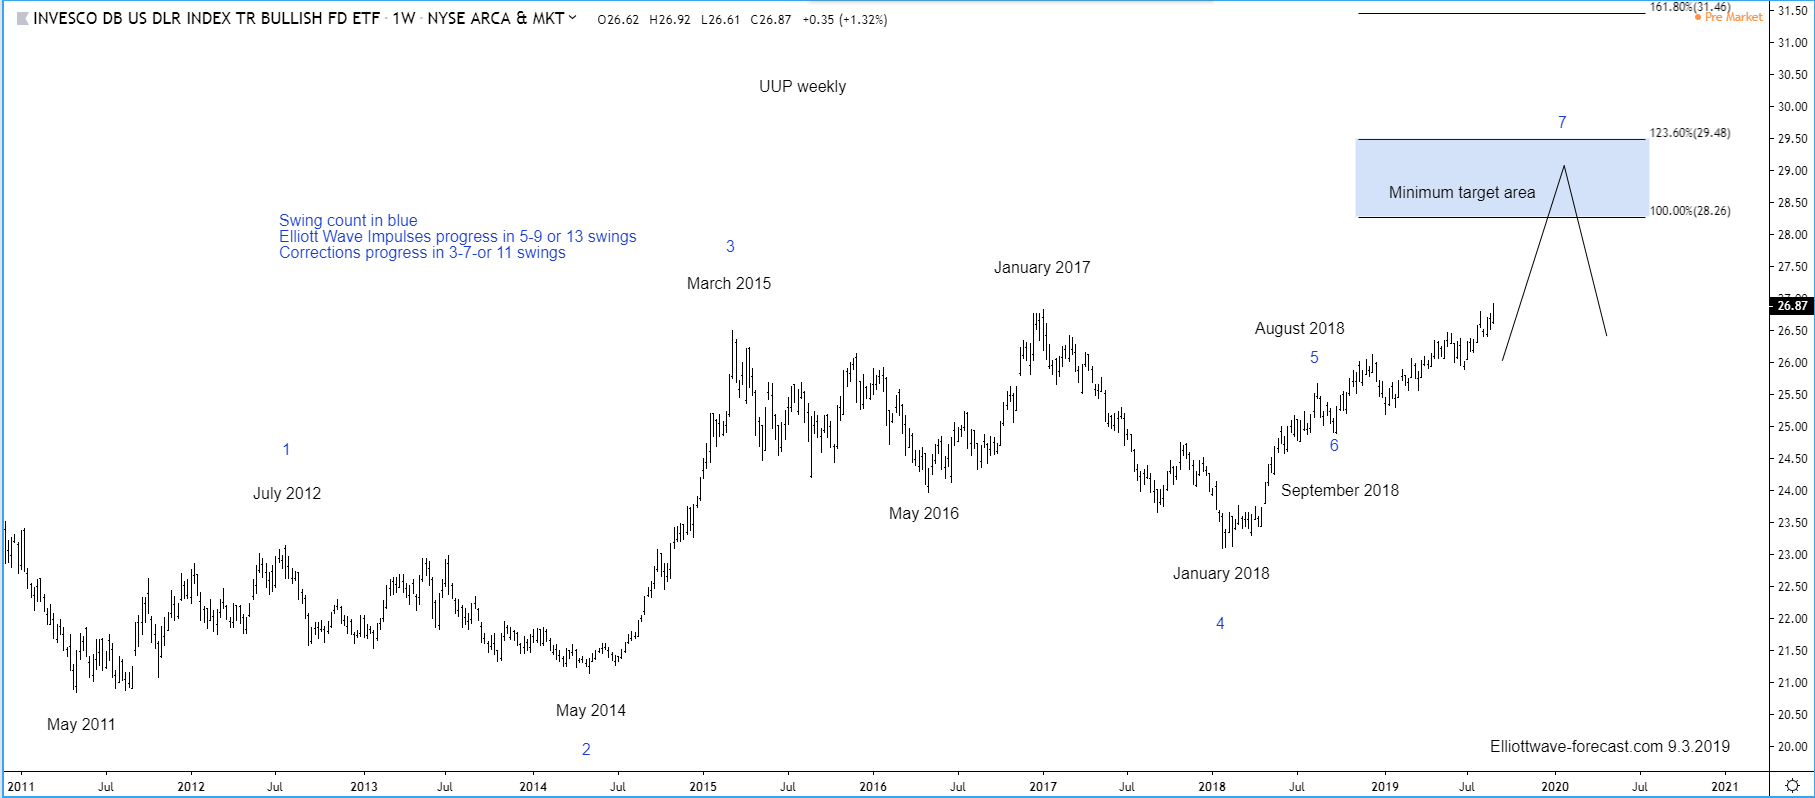
Secondly the bullish cycle up from the May 2011 lows in UUP appears to be advancing higher with some overlap in the cycles. This is as per would any diagonal. However price has marginally got above the January 2017 highs giving the dollar representative instrument a bullish sequence. From the May 2011 lows the dollar instrument appears to have at least 4 swings in place to the January 2018 lows. From there according to the momentum indicators used here it ended a cycle up at the August 2018 highs in a 5th swing. The reason of that being the relatively short in price percentage or time pullback into the September 2018 lows. That was strong enough to suggest it was 6th swing correcting the cycle up from the January 2018 lows.
The analysis continues below the UUP daily chart.
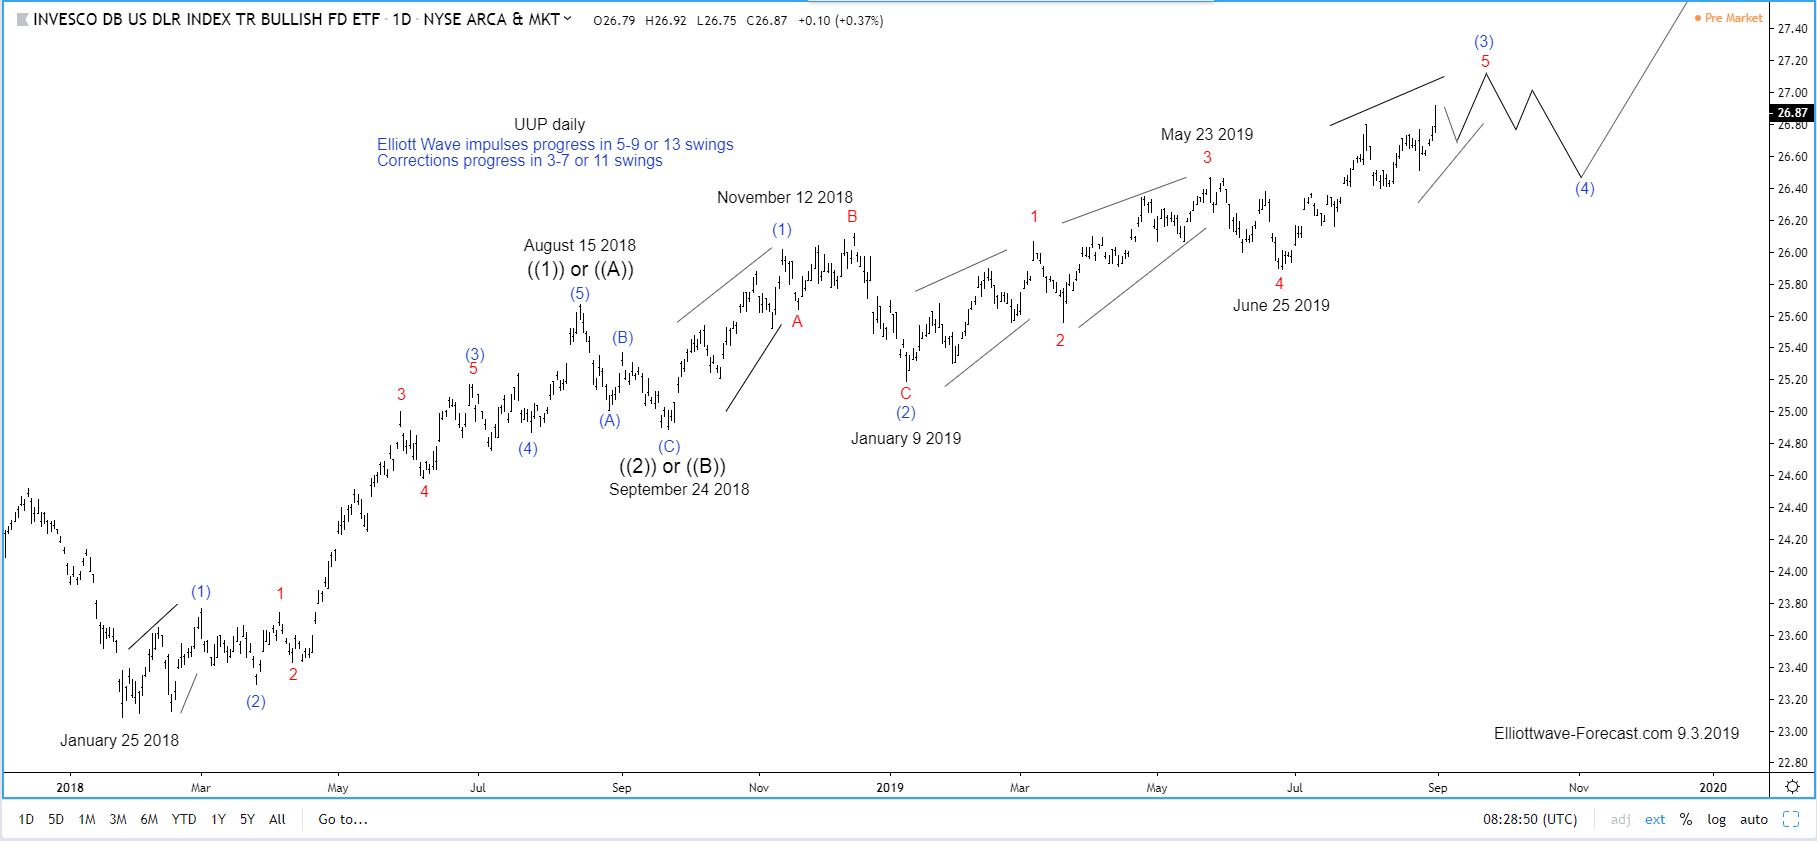
Thirdly and in conclusion, the swing and Elliott Wave count suggests further upside in the dollar. The dollar is bullish while near term dips lower show they will remain above the January 2019 lows, more ideally the June 25th lows. It can see further strength higher toward the 28.26-29.28 area before a significant turn back lower