Last month, we looked at the bearish incomplete sequence in $KC_F (Coffee) since 11.8.2016 peak but today we would be looking at the Elliott wave structure of the decline from 11.8.2016 peak in the daily time frame and decline from 10.19.2018 peak in the 480 minute time frame to give readers an idea of where we are in the decline at the moment and what opportunities could be knocking on the door soon.
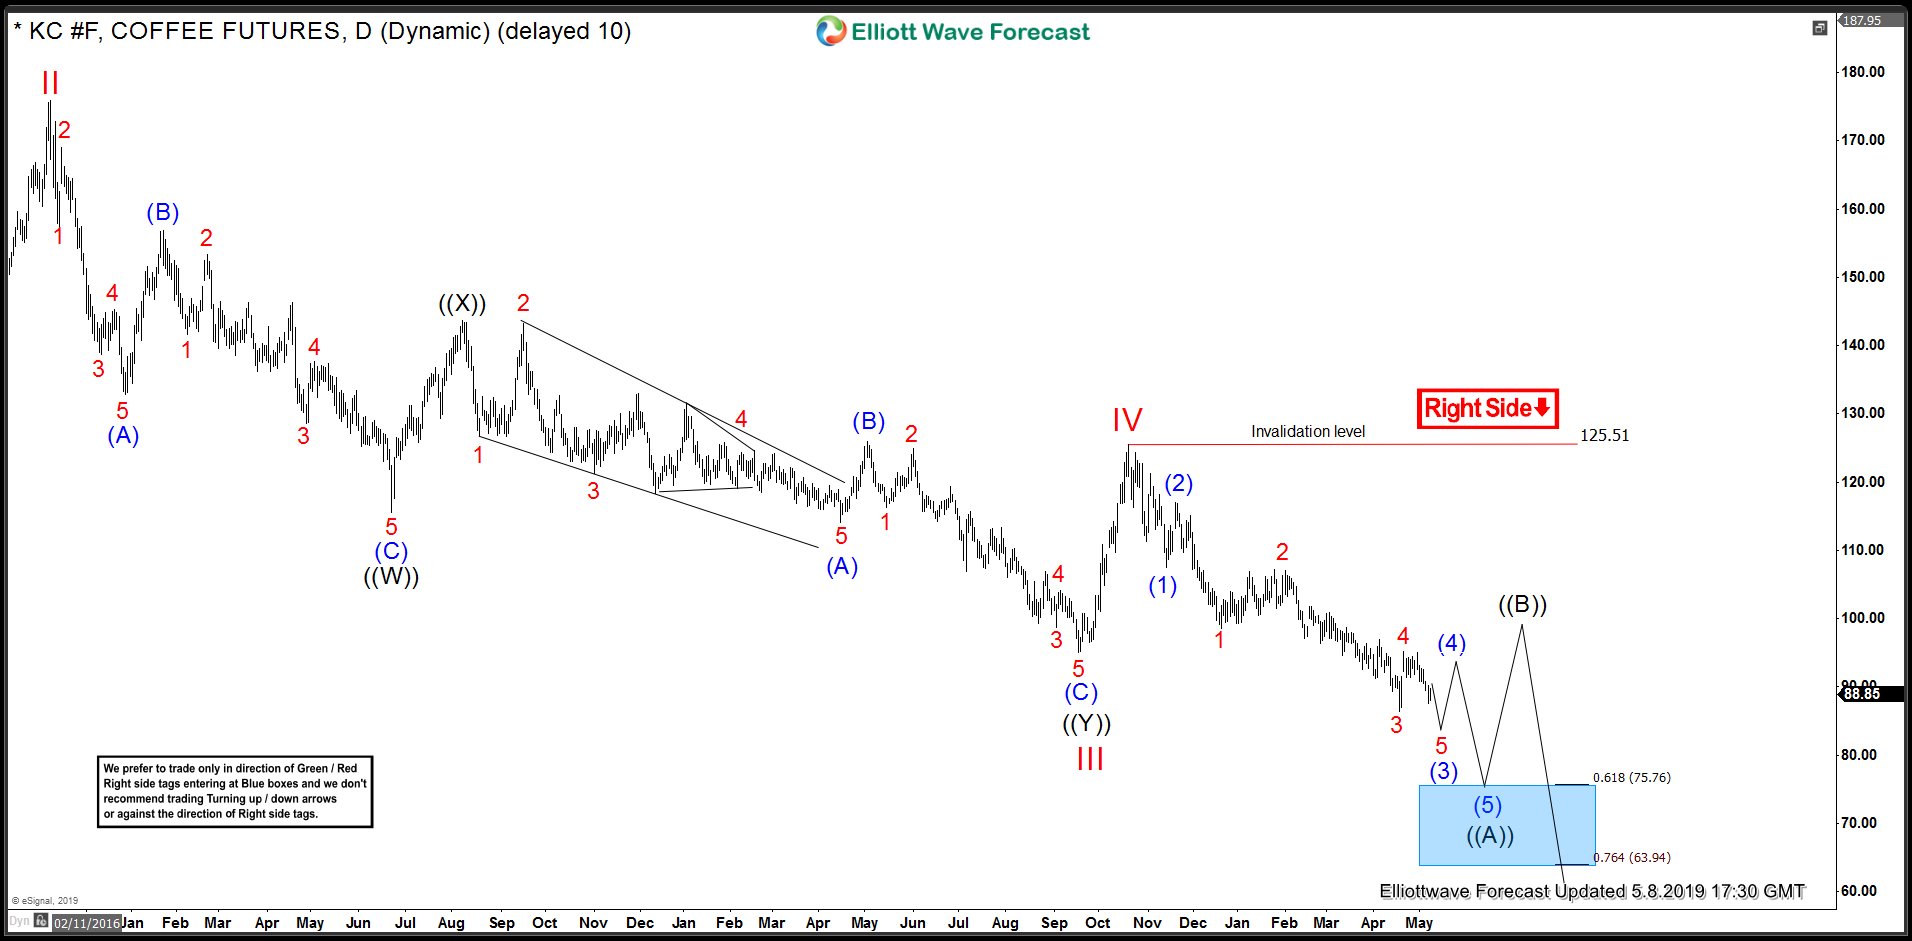
KC_F (Coffee) Daily Elliott Wave Structure
We are labelling the cycle from 2014 peak as a “c” wave diagonal of a zigzag structure down from 2011 peak. Rally to 2016 peak is labelled wave II of this proposed “c” wave Ending Diagonal structure. Down from there, Coffee dropped in 7 swings to $95.10 as a double zigzag Elliott wave structure. This labelled as ((W))-((X))-((Y)) when both ((W)) and ((Y)) unfolded as a zigzag and hence why it’s called a double zigzag structure.
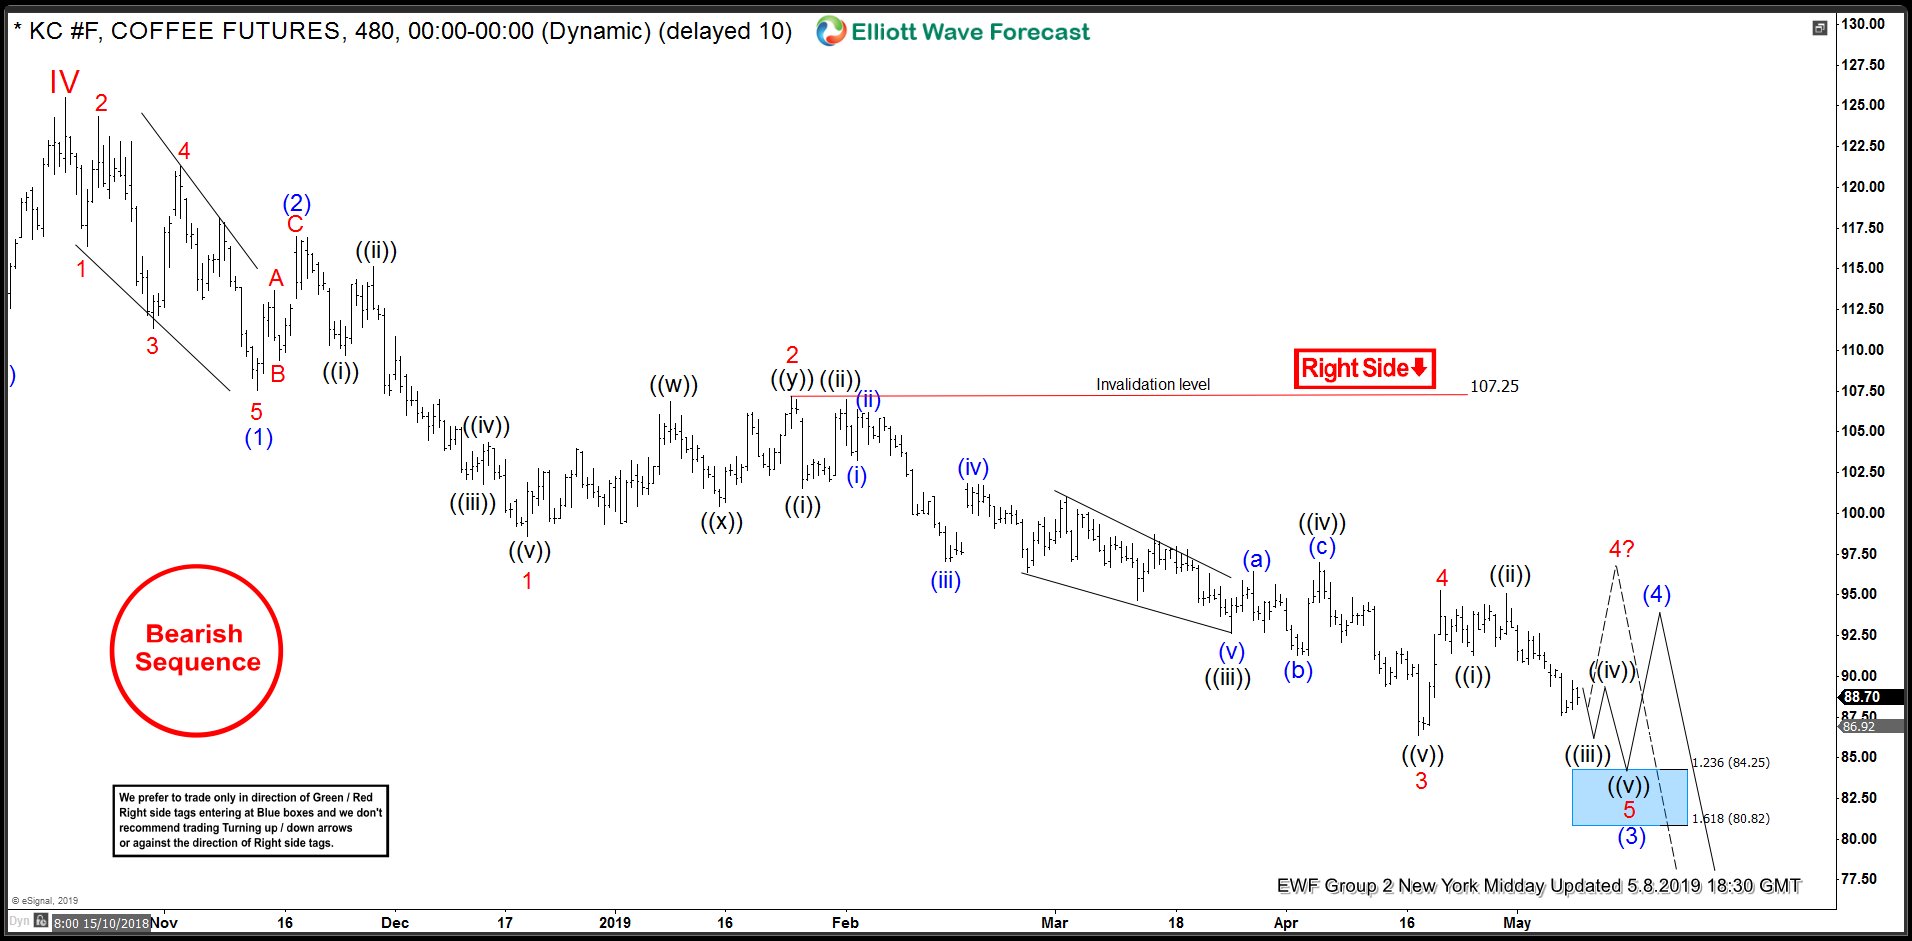
KC_F (Coffee) 480 minute Elliott Wave Structure
Decline from 10.19.2018 peak which is being labelled as wave IV of the proposed “c” wave diagonal is unfolding as an impulse when decline to 107.55 completed wave (1), bounce to 117.00 completed wave (2), down from there drop to 98.60 was wave 1 of (3), rally to 107.25 completed wave 2 of (3) and new lows to 86.35 could be viewed as wave 3 of (3). Swing recovery to 95.25 completed wave 4 of (3) and now new lows towards 84.25 – 80.82 should complete wave 5 of (3). Afterwards, we would expect another bounce in wave (4) in 3, 7 or 11 swings before it resumes the decline in wave (5) of ((A)) towards 75.76 area as shown on the daily chart. Failure to break below 86.35 and a break above 95.25 would suggest we are still in wave 4 as a double correction and should then still turn lower again. Alternatively, we could be in blue (5) lower already.