
GBPAUD Technical Analysis April 2019
Every trader should always view the market in the “bigger picture” first. Viewing the market starting from the higher time frame down to the lower time frames will offer a trader a better perspective on the possible price movements that the market can do. A “top down analysis” will offer a trader a clearer picture of the markets which will in return allow a trader to ultimately decide which side to trade. As you will see in the charts below a top down analysis was used at the start of April 2019 that led us to call the GBPAUD 500 pip move lower that we are currently seeing today.
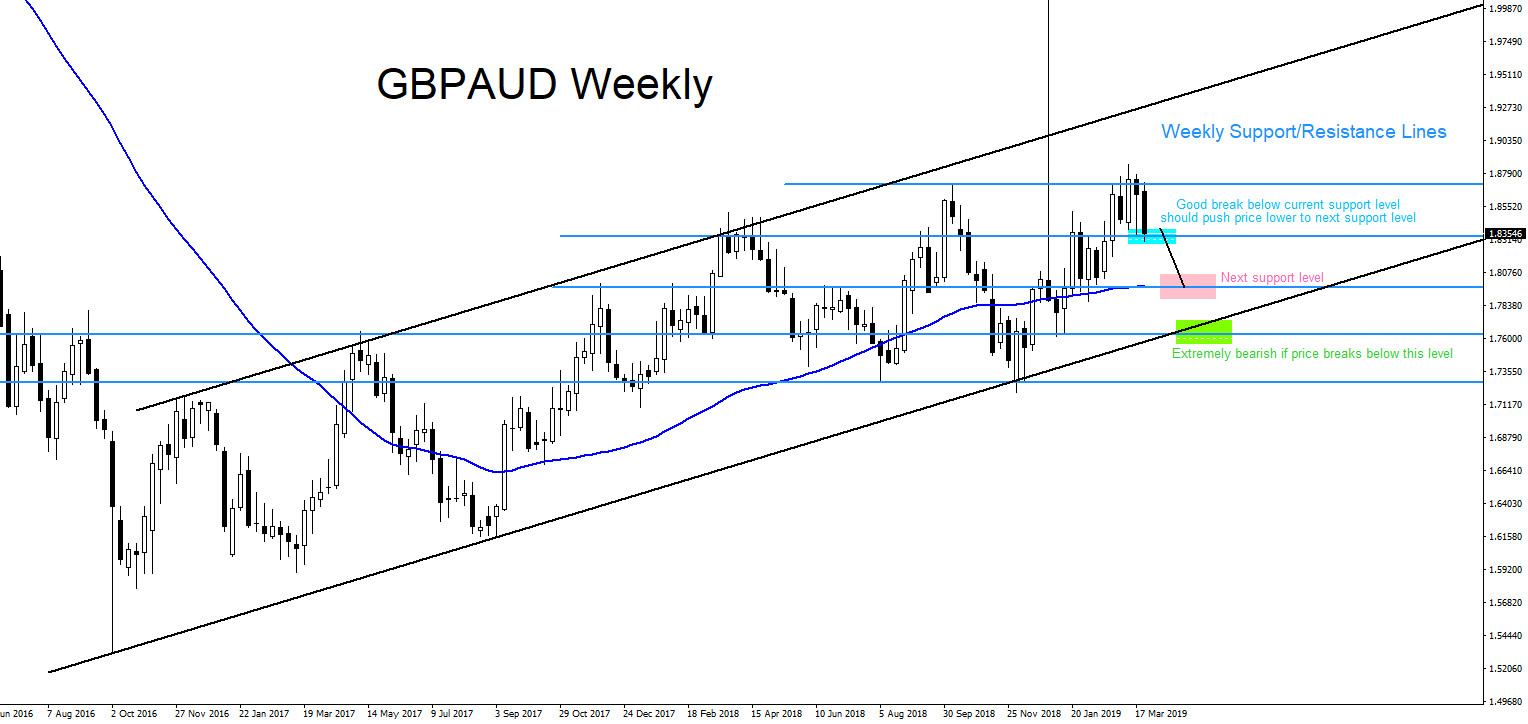
GBPAUD Weekly Chart 3.31.2019 : Weekly chart contains the possible support/resistance lines where price can possibly move towards. March 31/2019 we saw a strong bearish Weekly candle that formed which signalled that bears were in control and that price had a possibility of moving lower towards next level of support.
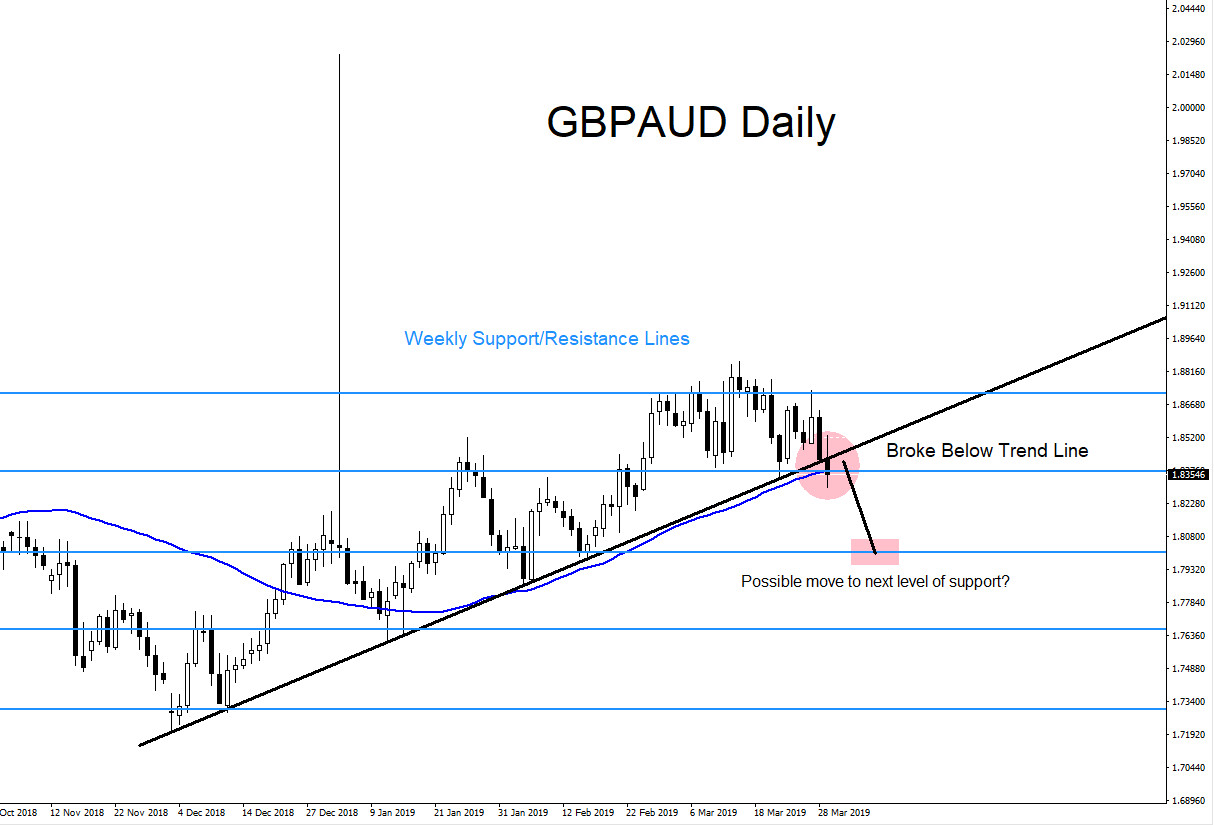
GBPAUD Daily Chart 3.31.2019 : On the Daily chart price broke below the ascending trend line which can also be signalling for a possible continuation lower to the next support level in the following days.
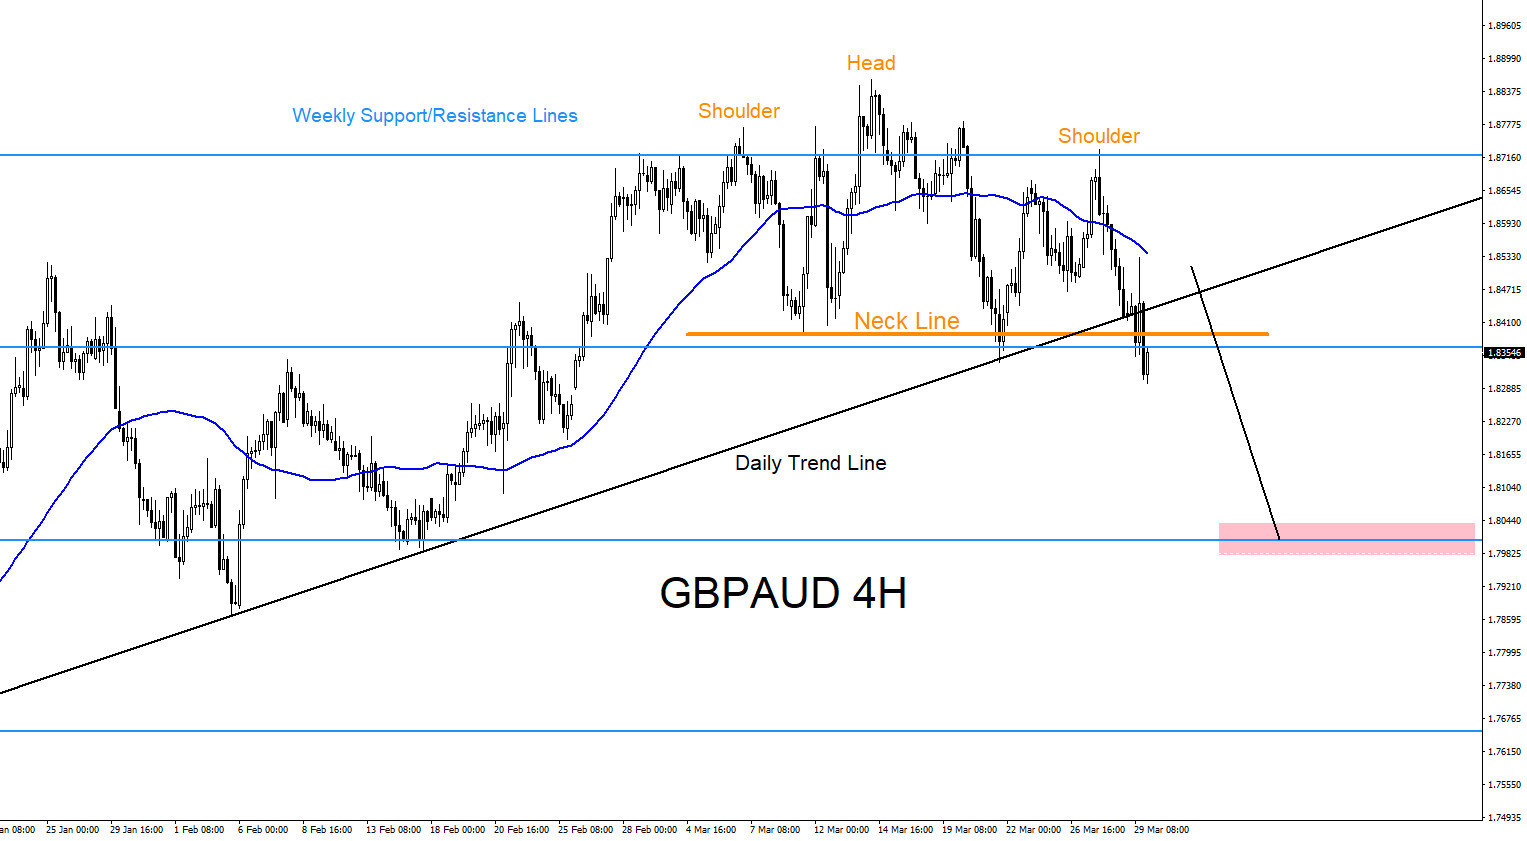
GBPAUD 4 Hour Chart 3.31.2019 : A clear bearish Head and Shoulders breakout pattern on the 4 hour chart triggered SELLS below the H&S neck line. The breakout below the neck line added more confirmation for traders to look for possible selling opportunities in the following days.
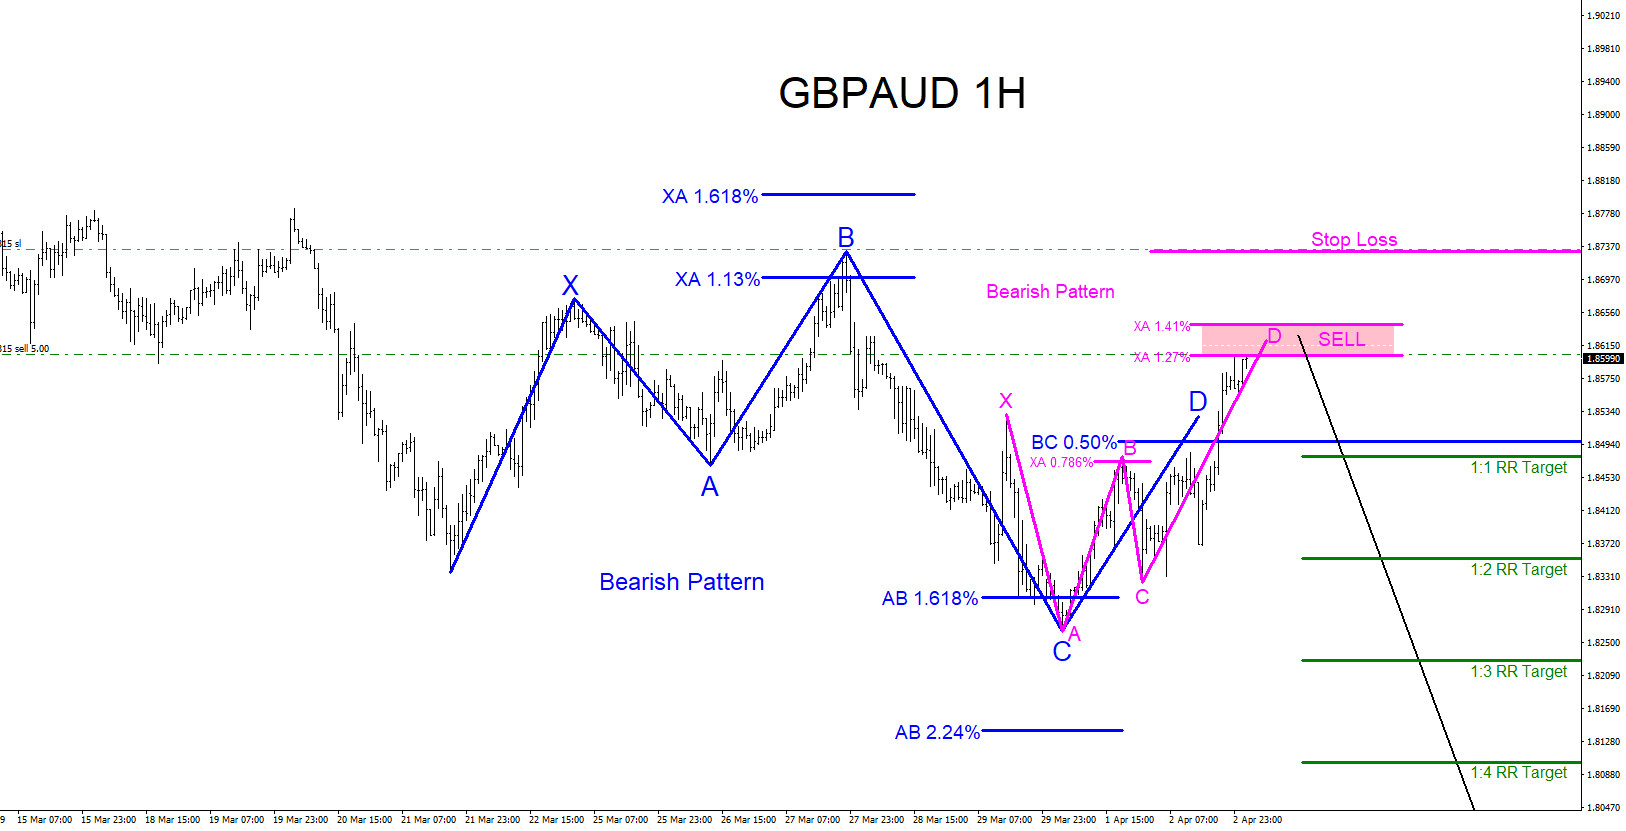
GBPAUD 1 Hour Chart 4.2.2019 : On the 1 hour chart bearish patterns formed which gave us the opportunity to SELL and enter the market. April 2/2019 we published this trade setup calling for the move lower
Price has since moved 500 pips lower from the 1.86 handle SELL entry area and can still continue lower towards next support level at the 1.80-1.79 area. A “top down analysis” will always allow a trader to get an overall outlook of where price can go.
Of course, like any strategy/technique, there will be times when the strategy/technique fails so proper money/risk management should always be used on every trade. Hope you enjoyed this article.
*** Always use proper risk/money management according to your account size ***
At Elliottwave-Forecast we cover 78 instruments (Forex, Commodities, Indices, Stocks and ETFs) in 4 different timeframes and we offer 5 Live Session Webinars everyday. We do Daily Technical Videos, Elliott Wave Trade Setup Videos and we have a 24 Chat Room. Our clients are always in the loop for the next market move.