
Welcome traders, today we will look at a couple of USDSEK pair charts.The following analysis will show how profitable and efficient it can be to trade with our philosophy and basic Elliott Wave analysis.
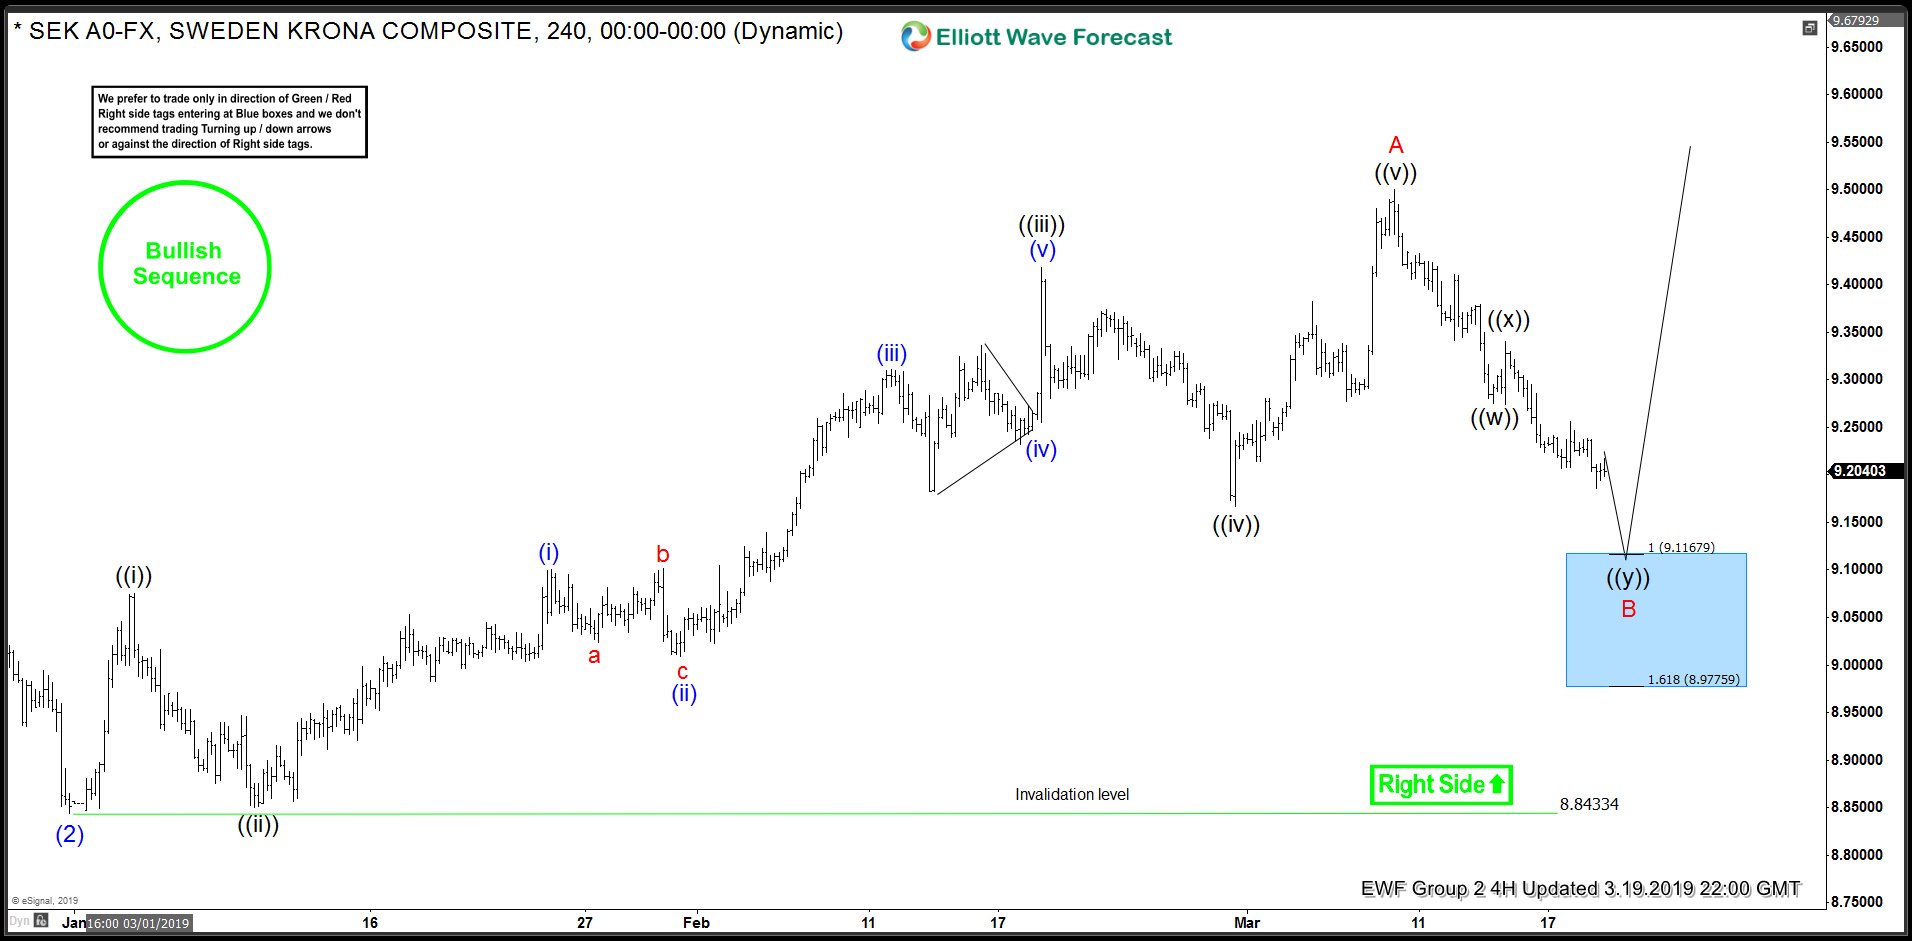
First of all, we start on March 19 2019 with a 4-hr chart presented to our members. At the time, we maintained a bullish perspective due to our Elliott Wave analysis. Moreover, an incomplete bullish sequence to the upside (green bullish stamp). The top shown below labeled as wave ‘A’, serves as a resistance after finishing a 5 wave move. From there, according to Elliott Wave theory, we expect a pullback. Due to the straight down pullback, followed by 2 bounces failing to break wave ‘((A))’, it led us to believe 3 swing pullback was developing. More specifically, a ((w))-((x))-((y)) double Elliott Wave zigzag structure forming for wave ‘B’.
Under our methodology, our members are encourage to take action with a confirmed ‘right side of the market’. This is the meaning of the green ‘RightSide’ arrow. So, we let the market shows itself and we adapt our count to make sense of the price action. When wave ((x)) is confirmed, a 1:1 minimum target and a 1:1.618 extreme target is derived. These targets are combined to provide a high probability area for a reversal (this are is illustrated as a blue box). To add to this, a crucial rule in our methodology is a sequence must finish as a complete 3,7 or 11 swing move. So, based on this, our members are fully encouraged to take long position in this particular case.
USDSEK 3.19.2019 4-Hr Chart Elliott Wave Analysis
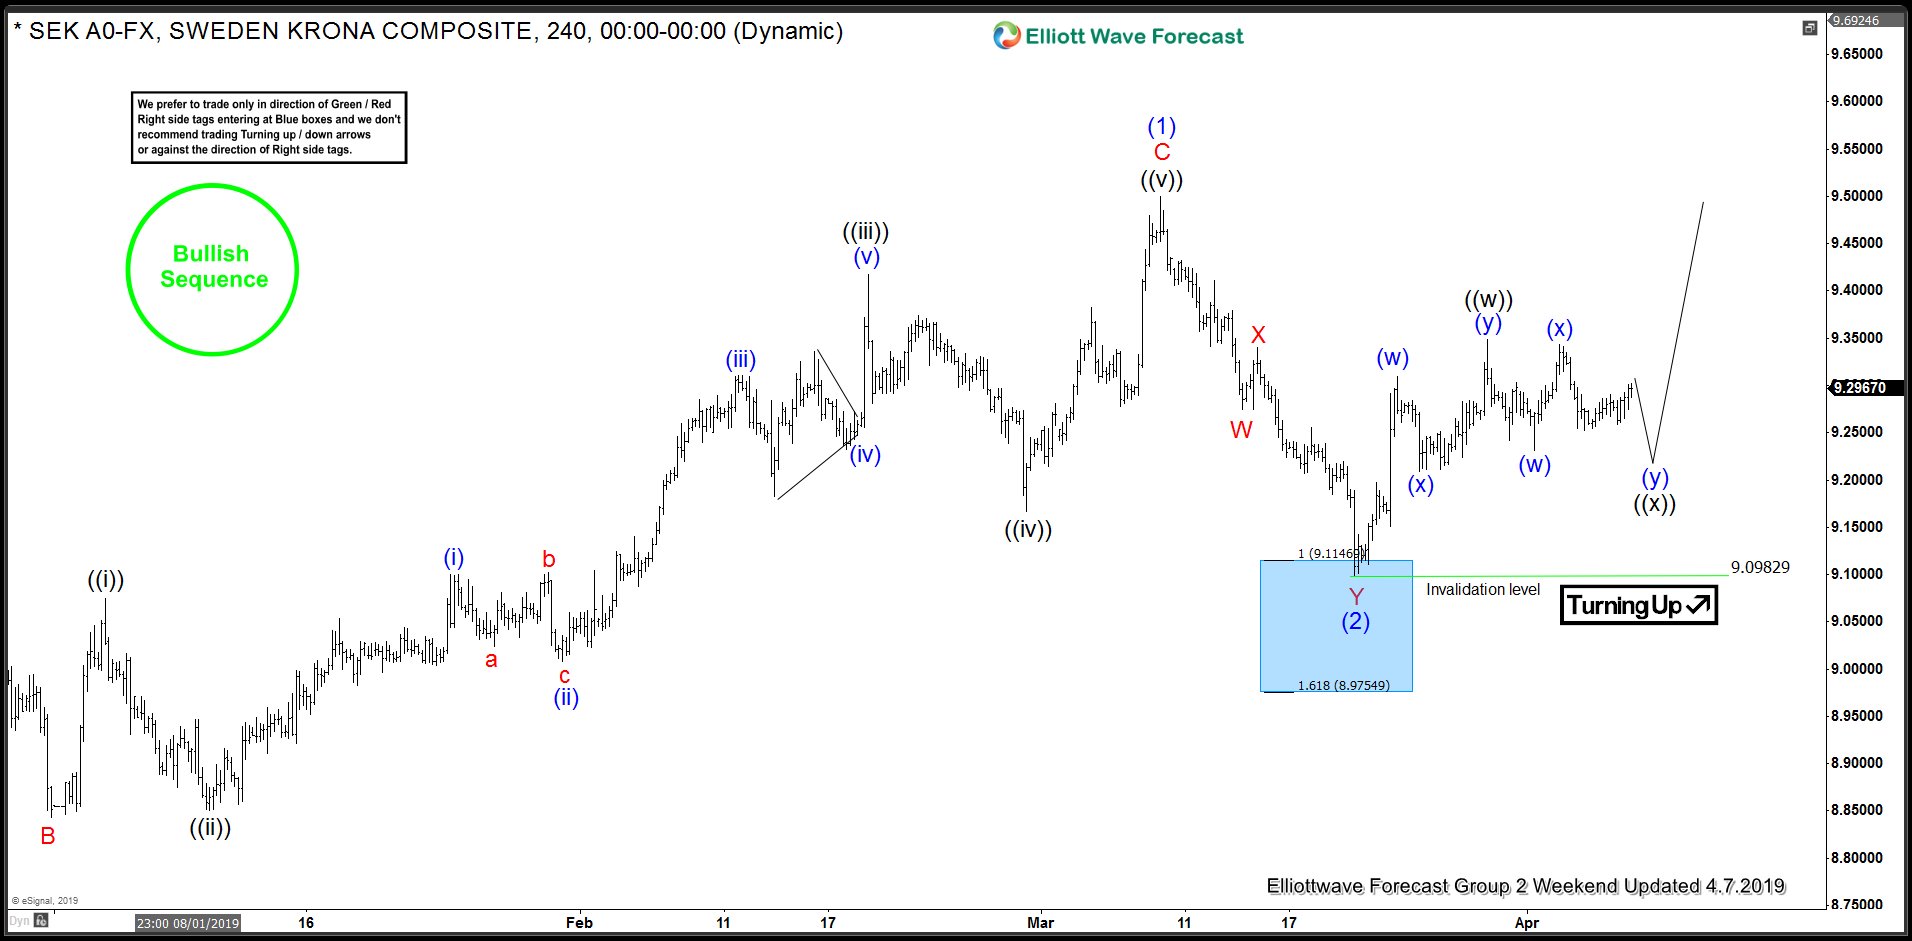
Below you can see an updated chart of the instrument from April 7th. Notice how the pair reacted off of the blue box target area and resumes the upside. Our members took a long trade from 9.117 in Live Trading Room and now has a risk free trade with stop at break even. At this stage however, the pair is no longer at extreme area so we don’t recommend opening a new position. Pair now needs to break above wave (1) to avoid a double correction. Trading is always about taking a chance. But, what can be better than taking a chance with probabilities on your side. With a mapped entry, an invalidation level set up, the right side, sequences, add up to great trading opportunities. Waiting for the right signals proved to be successful and we got the proposed reaction as expected.
USDSEK 4.7.2019 4-Hr Chart Elliott Wave Analysis
*Note : The market is dynamic and our view is bound to change after date posted.
Trading success is a journey and you will never be perfect at it, but you can always master your reaction to the market.