Back in September 2018, we highlighted that USDMXN Elliott wave analysis suggested bounces should fail below 6.15.2018 peak for extension lower. The bounce did fail below 6.15.2018 peak as pair formed a secondary peak on 12.6.2018 and turned lower. Cycle from 12.6.2018 peak ended on 1.17.2019 and pair bounced to correct the decline from 12.6.2018 peak. This corrective bounce ended on 3.7.2019 and this week USDMXN managed to break below 1.17.2019 peak which has created a bearish sequence down from 12.6.2018 peak. In this video blog, we will take a look at the downside targets to complete cycles from 6.15.2018 peak and 12.6.2018 peaks. We will also look at how this impacts USDPLN wave structure and path going forward.
USDMXN Bearish Sequence and Cycle from 12.6.2018
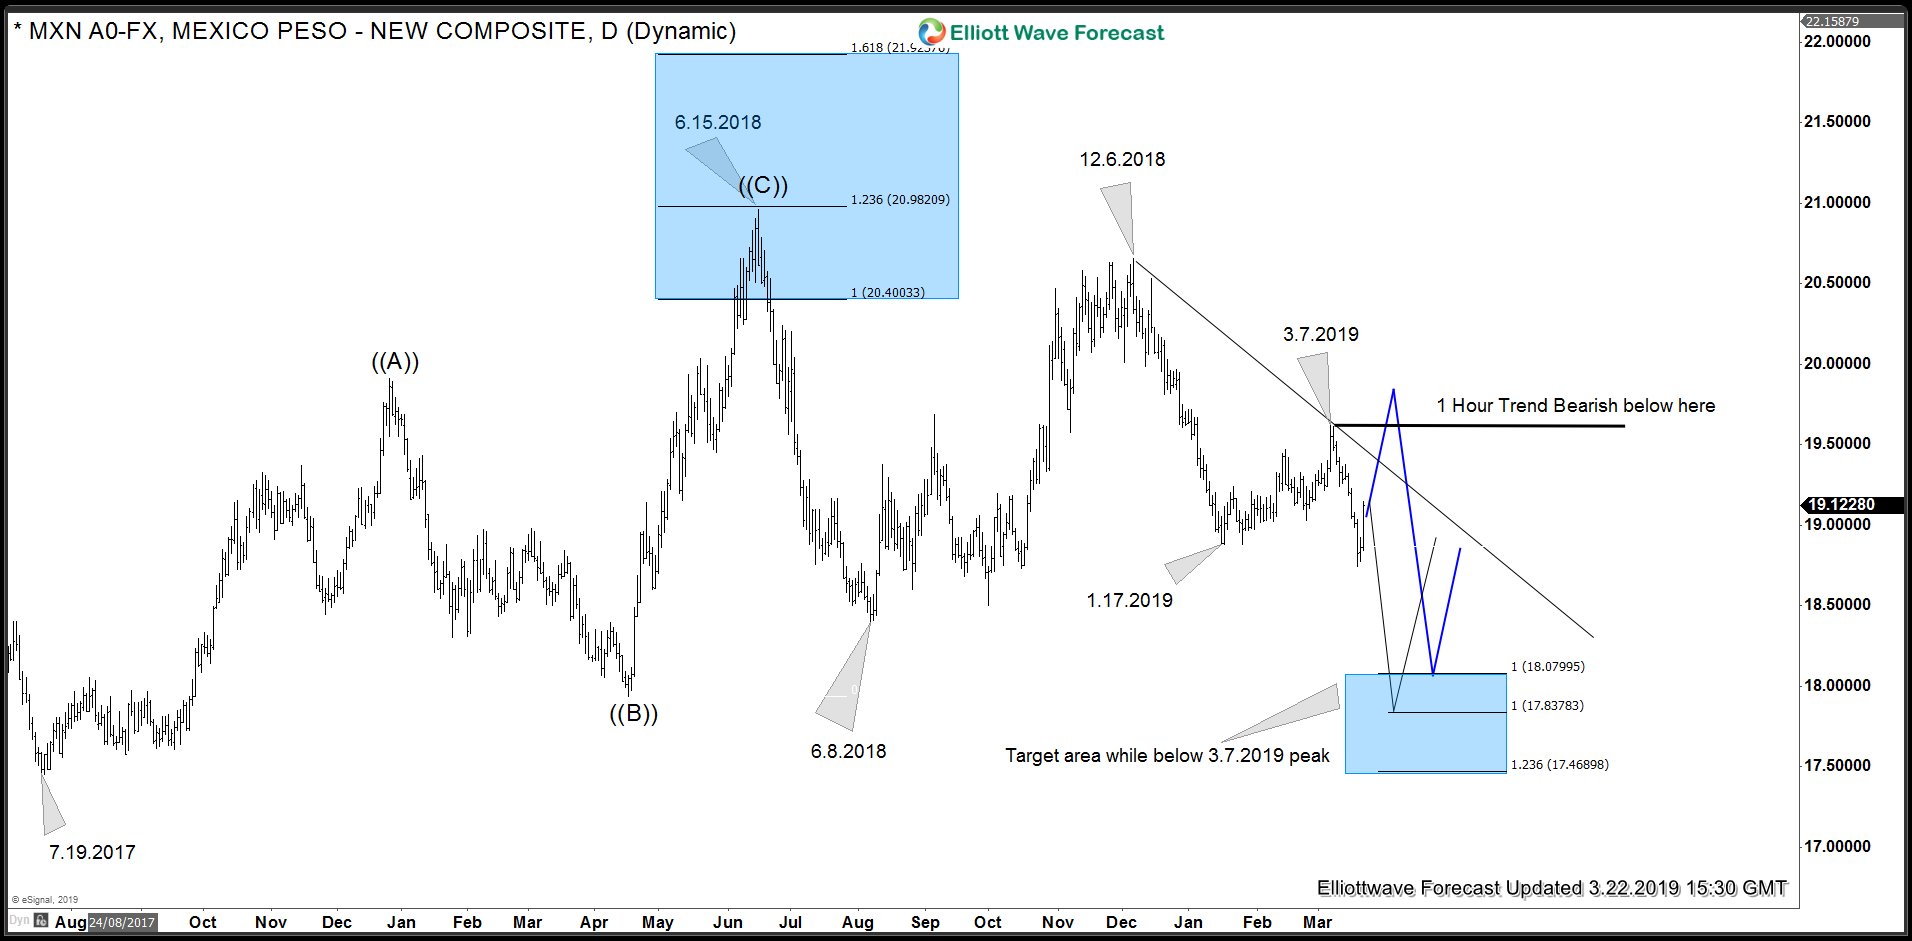
Chart below shows the incomplete sequence created as a result of break below 1.17.2019 peak. Now, as bounces fail below 3.7.2019 peak, the pair should continue lower towards 18.0799 – 17.4689 area. 18.0799 is the 100% Fibonacci extension of 6.15.2018 – 6.8.2018 cycle related to 12.6.2018. Whereas, 17.8378 is the 100% Fibonacci extension of 12.6.2018 – 1.17.2019 cycle related to 3.7.2019. Due to incomplete sequence down from 12.6.2018 peak, any bounces should find sellers in the sequence of 3, 7 or 11 swings as far as 3.7.2019 high remains in place.
If the downtrend line from 12.6.2018 through 3.7.2019 breaks and more importantly the pivot at 3.7.2019 high gives up in the distribution system, then pair could rally above 3.7.2019 to complete a FLAT correction from 1.17.2019 low and then continue lower towards 18.0799 area. (path shown with blue lines on the chart)
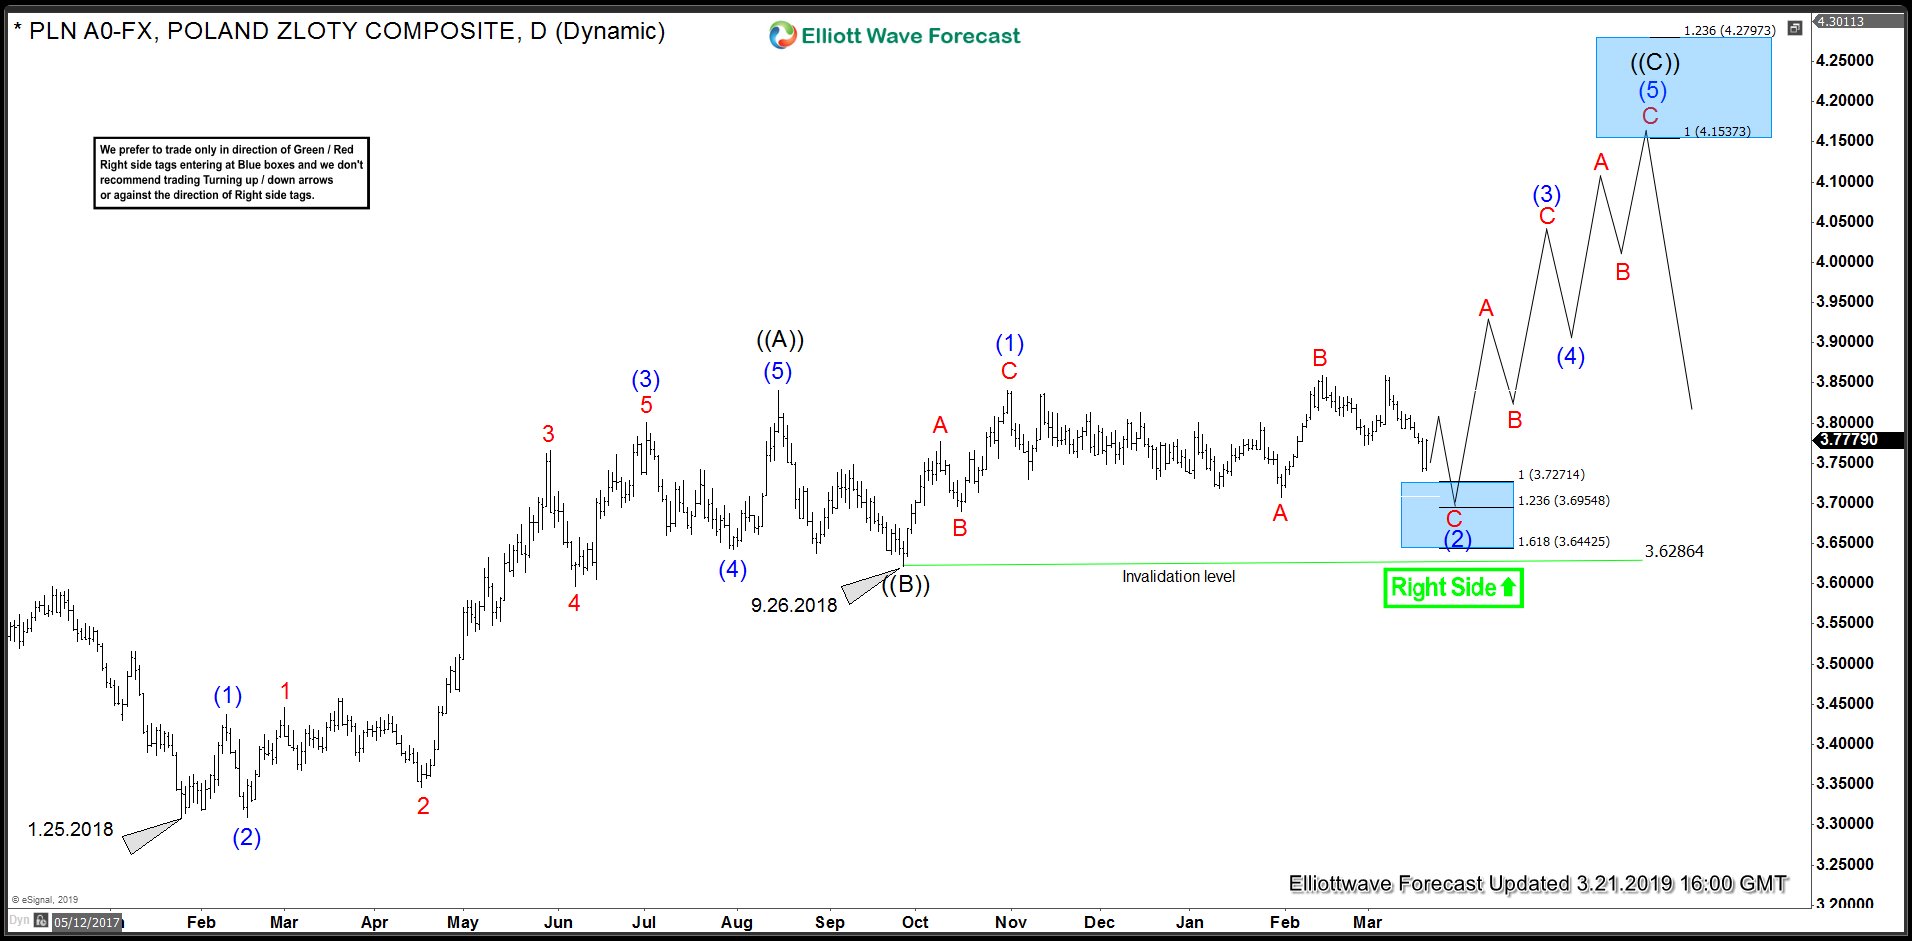
USDPLN Could Stays Sideways to Lower and Rally When USDMXN Reaches Blue Box
USDPLN continues to show an incomplete bullish sequence up from 1.25.2018 low and has an extra swing. However, the pivot at 1.31.2019 low has given up and USDMXN is showing a bearish sequence against 3.7.2019 peak which suggests USDPLN could also bounce and make another low to complete 5 swings down from red B wave high and complete a possible Elliott Wave FLAT structure down from blue wave (1) peak and resume the rally. Ideal time for rally to resume would be when USDMXN reaches blue box shown in the chart above, until then USDPLN and DXY could stay sideways or extend lower.