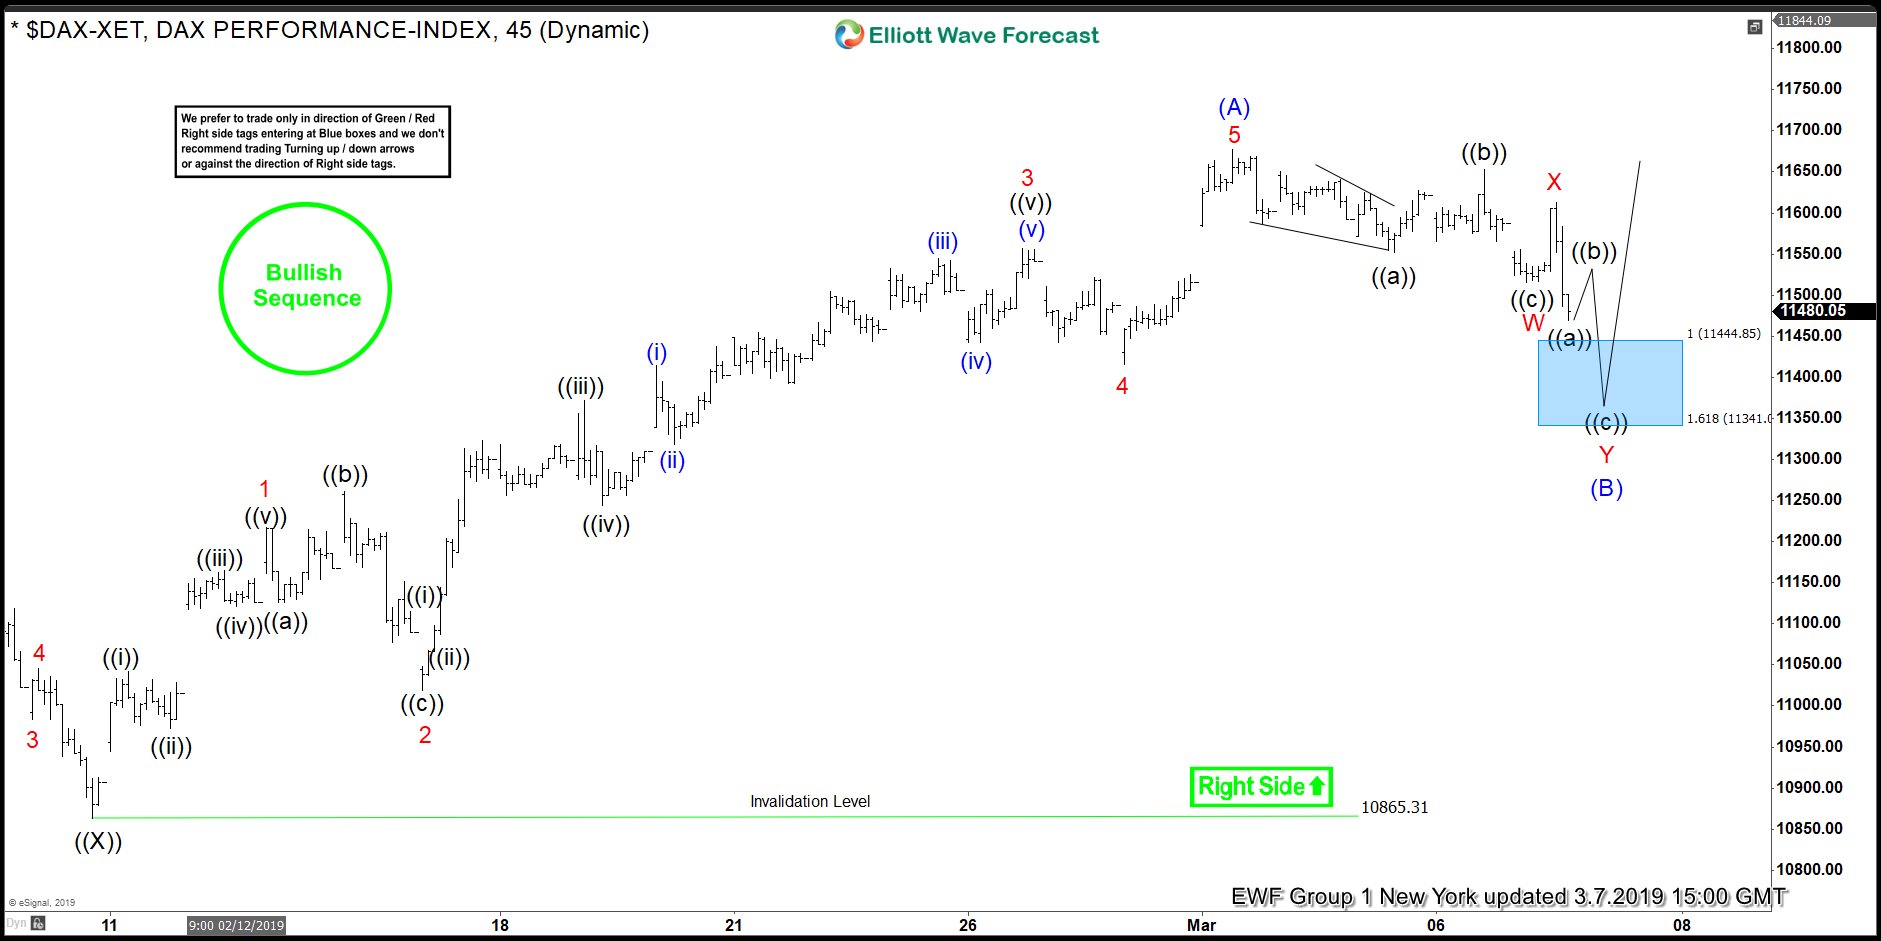
Short Term Elliott Wave view in DAX shows a bullish sequence structure from December 28, 2018 low, favoring further upside. The Index has potential to reach 100% extension towards 11912 – 12157 before ending cycle from December 2018 low. The rally from December 28, 2018 low is unfolding as a double three Elliott Wave structure where wave ((W)) ended at 11321.62 and wave ((X)) ended at 10865.31.
Wave ((Y)) rally is unfolding as a zigzag Elliott Wave structure. The first leg wave (A) of this zigzag ended at 11676.86 as 5 waves impulse. Up from 10865.31, wave 1 ended at 11217.3, wave 2 ended at 11018.95, wave 3 ended at 11556.87, wave 4 ended at 11416.08, and wave 5 of (A) ended at 11676.86. Wave (B) pullback is now in progress to correct cycle from Feb 9, 2019 low (10865.31) before Index resumes the rally higher.
Wave (B) pullback should unfold in 3, 7, or 11 swing. Down from 11676.86, wave W ended at 11551.45, and wave X ended at 11652.77. The next wave Y extreme area in 7 swing comes at 11442 – 11523 where buyers can appear for further upside or a 3 waves bounce at least. Alternatively, Index can also do a Flat correction in which case it can turn lower in 5 waves within wave C of (B) before buyers appear. As far as pivot at 10865.31 low stays intact in the pullback, expect Index to resume higher.
1 Hour DAX Elliott Wave Chart
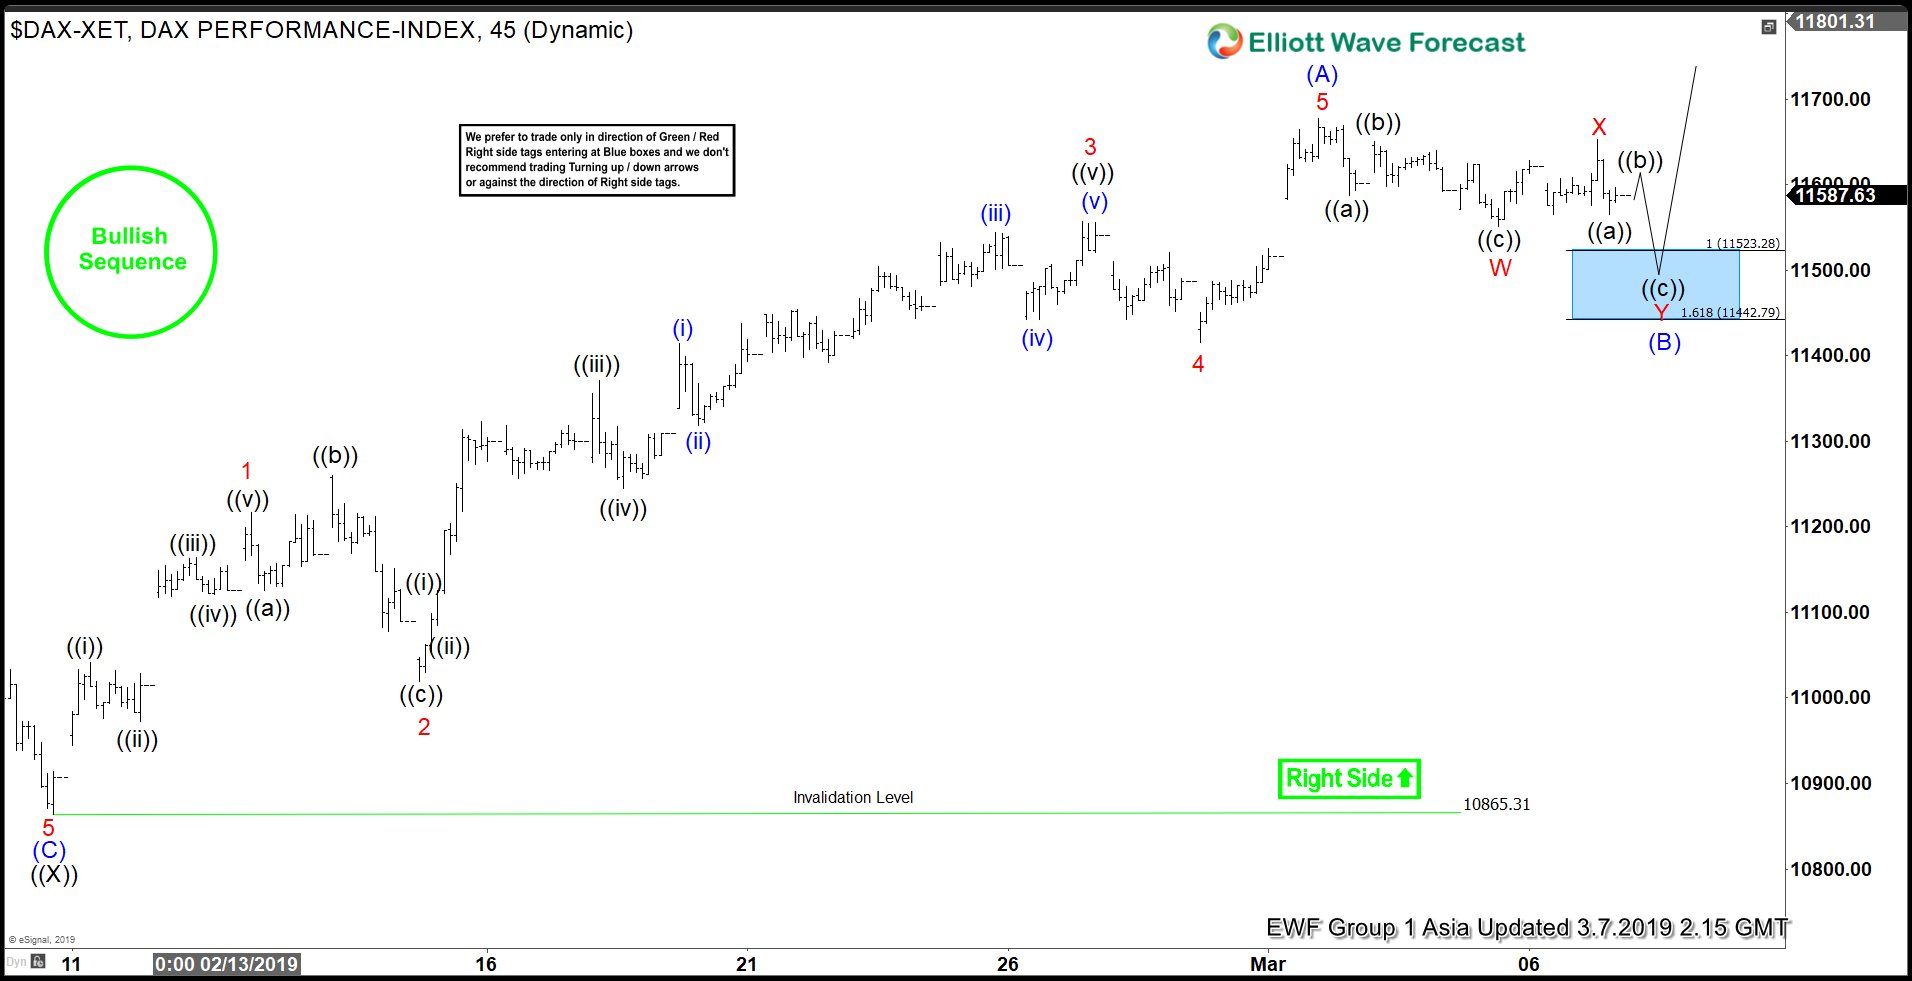
[UPDATE] DAX 1 Hour Elliott Wave Analysis 3.7.2019
DAX found buyers in blue box in the chart above and bounced to reach 50% of the decline from red X peak (11652.77) and then it made a new low so we are now looking for 7 swings lower to complete wave (B) in 11445 – 11341 area where buyers should appear to resume the rally for new highs or produce a 3 waves bounce at least.