
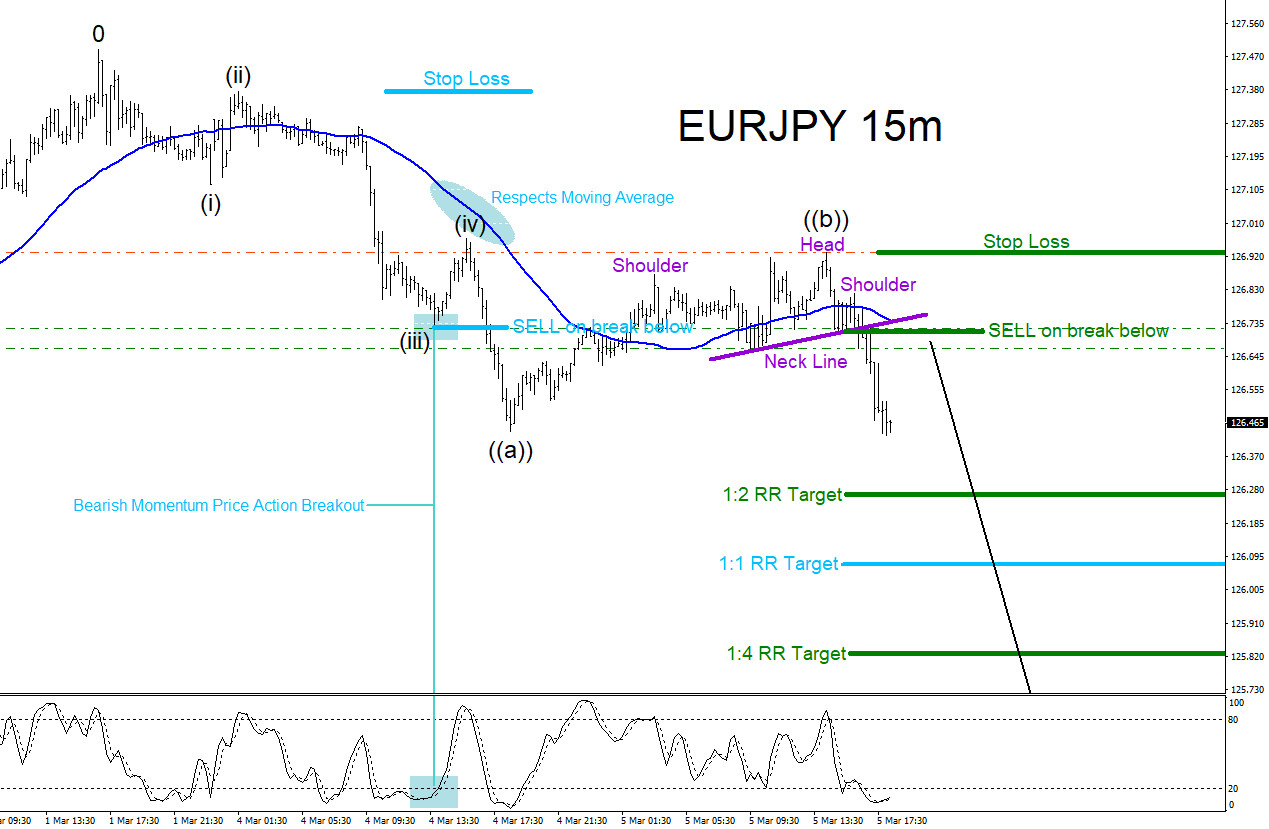
EURJPY SELL/SHORT Trade : Elliott Wave count for EURJPY shows wave ((a)) completed starting from the March 1/2019 highs and has since corrected higher to terminate possibly the wave ((b)) at the March 5/2019 high. Using Market Patterns together with a working Elliott Wave count allows traders to get more confirmation on which side to trade. In the chart below, there was a clear bearish Market Pattern (purple Head and Shoulders Bearish pattern) that had triggered SELLS on the break below the Neck Line which has pushed EURJPY lower. A possible Elliott Wave bearish Zig Zag 5-3-5 pattern, starting from the March 1/2019 high, can be forming so wavers should watch to see another 5 waves lower on the current wave ((c)) lower. There is still a possibility of an Elliott Wave expanded flat pattern where price can push higher above the March 5/2019 high but for now as long the March 1/2019 high holds the wave count remains valid for EURJPY to continue lower. We remain bearish EURJPY expecting to hit targets at lower prices.
EURJPY 15 Minute Chart 3.5.2019
Of course, like any strategy/technique, there will be times when the strategy/technique fails so proper money/risk management should always be used on every trade. Hope you enjoyed this article.