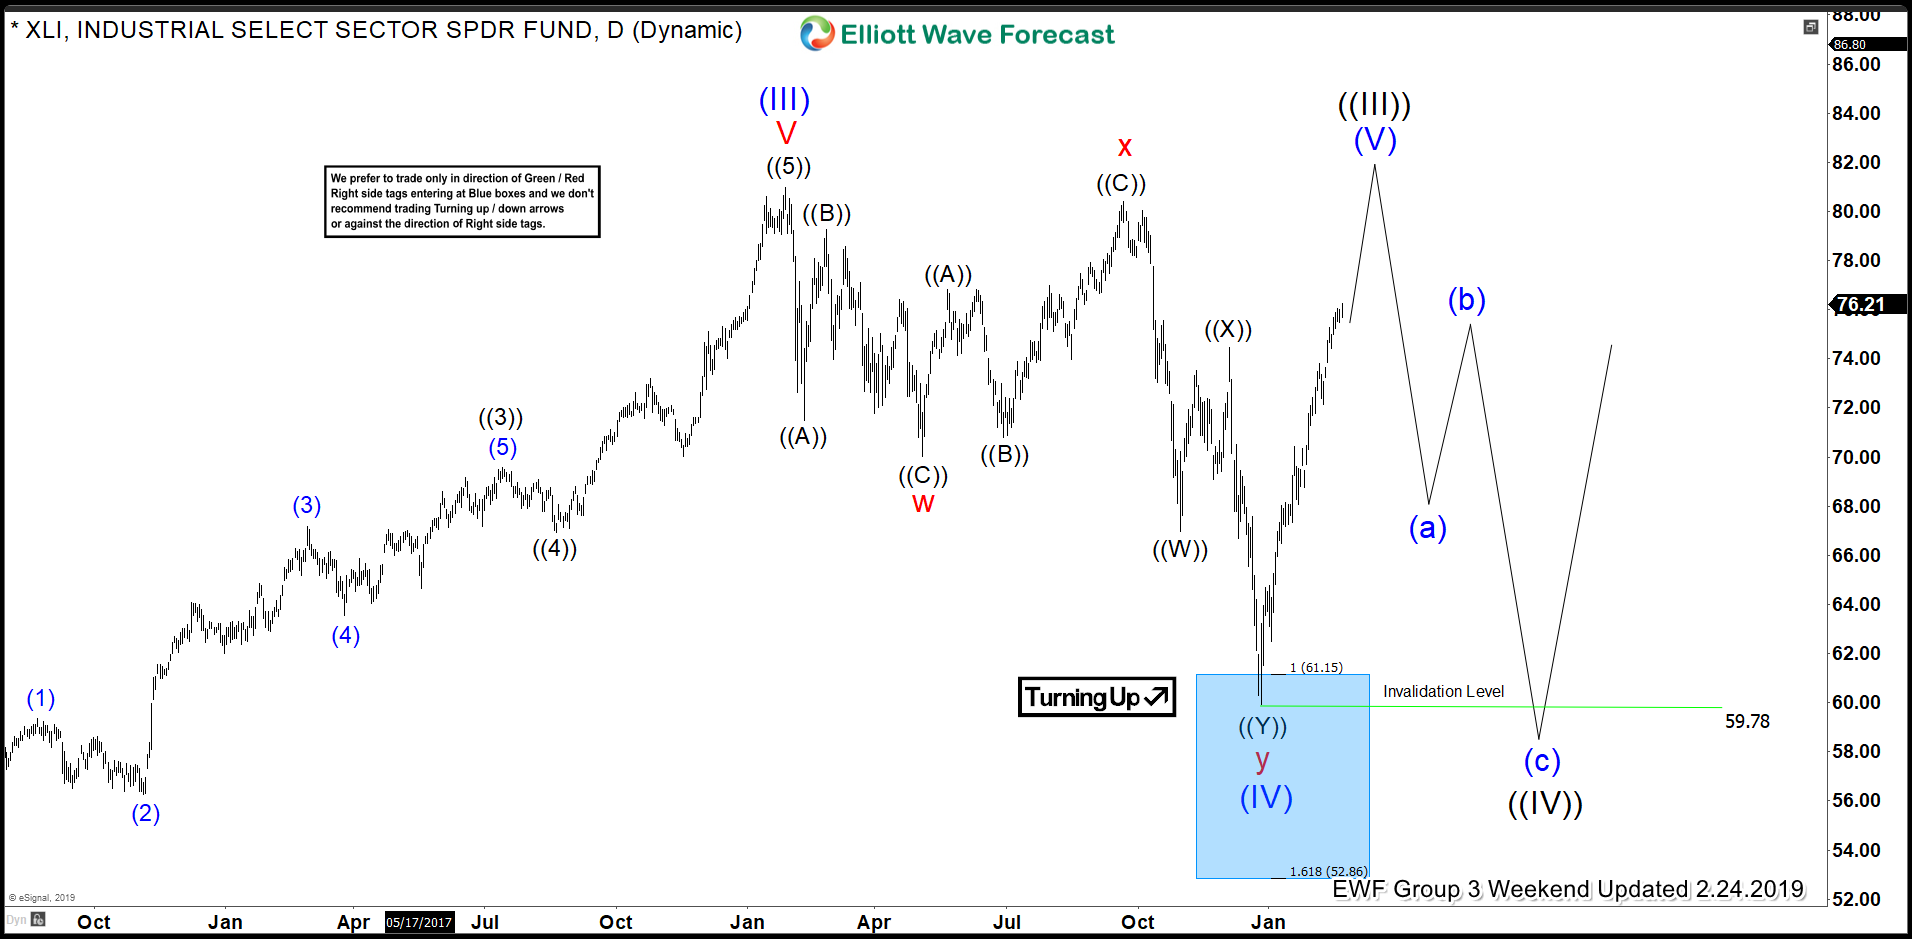
XLI Set to Make New Highs
The Industrial Sector ETF, XLI, is set to make new all-time highs above the January 2018 high at 80.96. From 80.96 Elliott wave analysis suggests XLI corrected lower on the daily chart in 7 swings to the 12/26/2018 low of 59.92. Within the final 3 waves of y (red label) we see a near perfect measurement of equality amongst the subwaves. From the red x high of 80.41 on 9/20/2018 the ETF dropped lower in 3 swings into the blue box range producing a reaction higher. We are labeling the 59.92 low as wave (IV) suggesting wave (V) of ((III)) is now progressing above 80.96. The Blue Box highlighted below in the daily chart are measured areas with a high probability of reaction in the next projected direction.
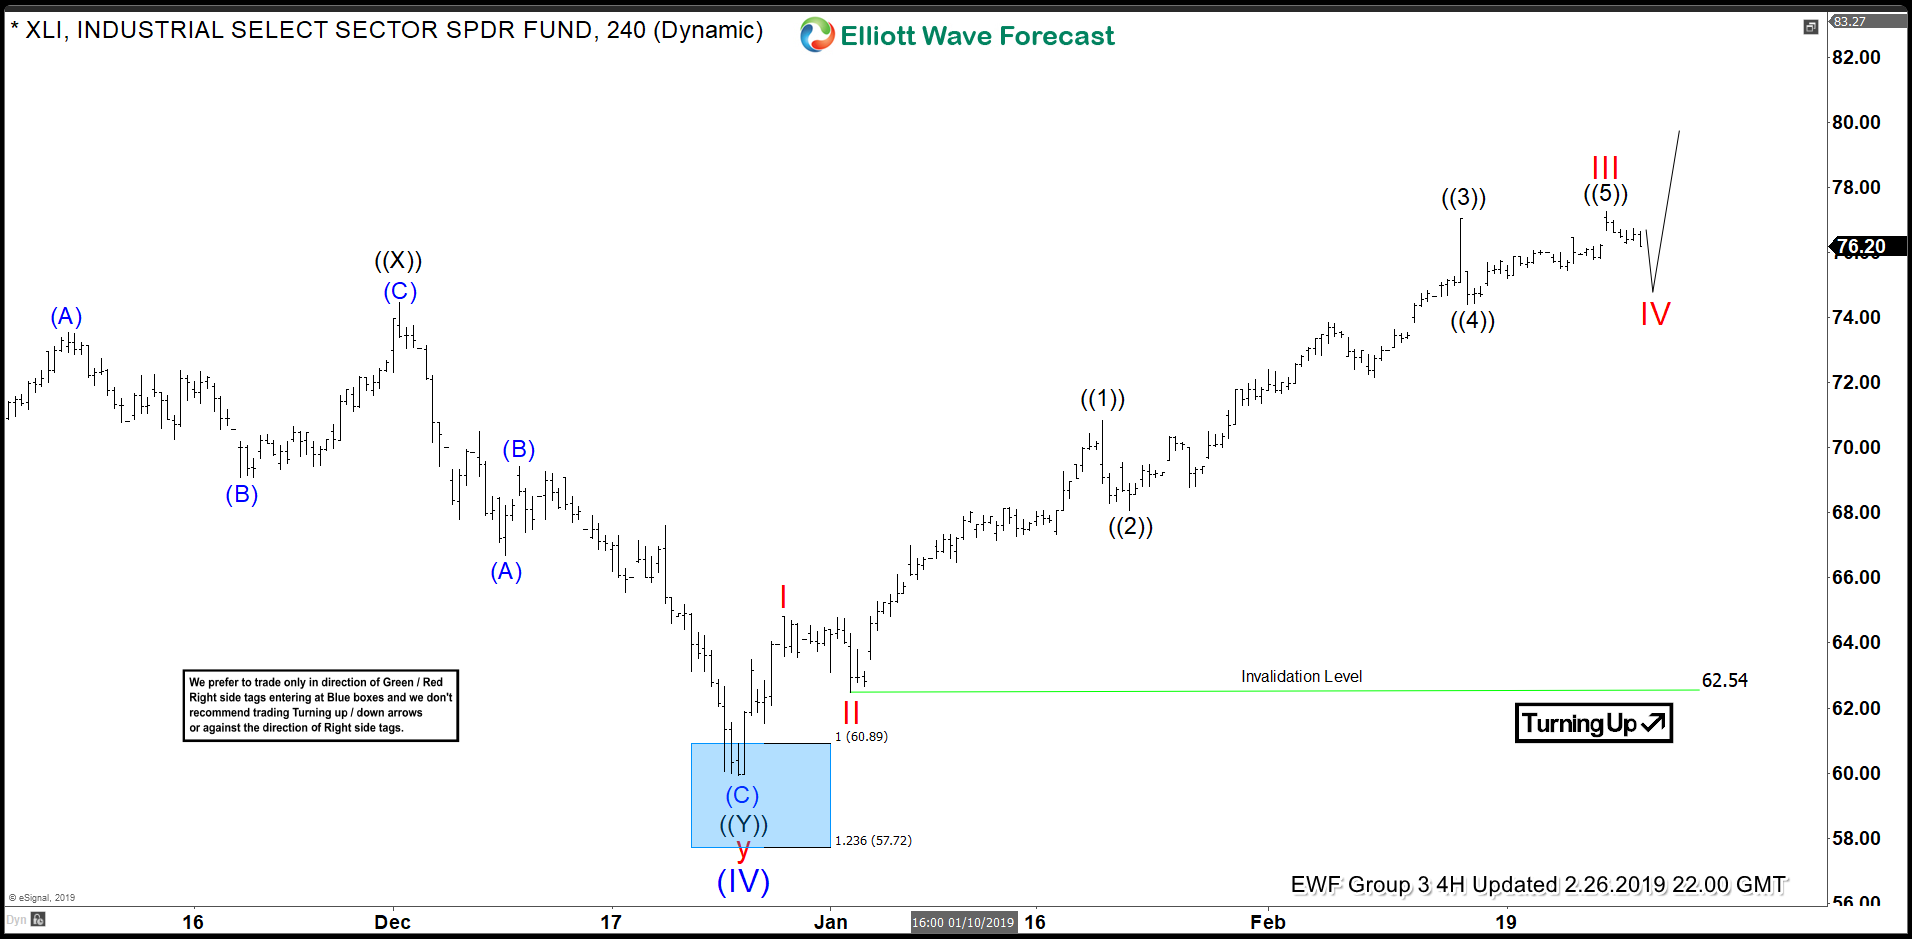
The 4 hour Chart Progression is Incomplete
From the December 2018 low we observe 7 swings in the chart. In our system of analysis we suspect XLI to be impulsive to the upside. Consequently this observation dictates that to be impulsive the ETF must complete a derivative of a 5 swing move from 59.92. So far we have 7 swings which is a derivative of a corrective 3 wave sequence. Corrections unfold in swings of 3,7,11,15, etc. Impulses unfold in derivatives of a 5 swing sequence. Hence the count from 59.92 in XLI should have a clear 5, 9, 13 and so on number of waves. Since we only have 7 the cycle from the low is incomplete thus calling for new highs.