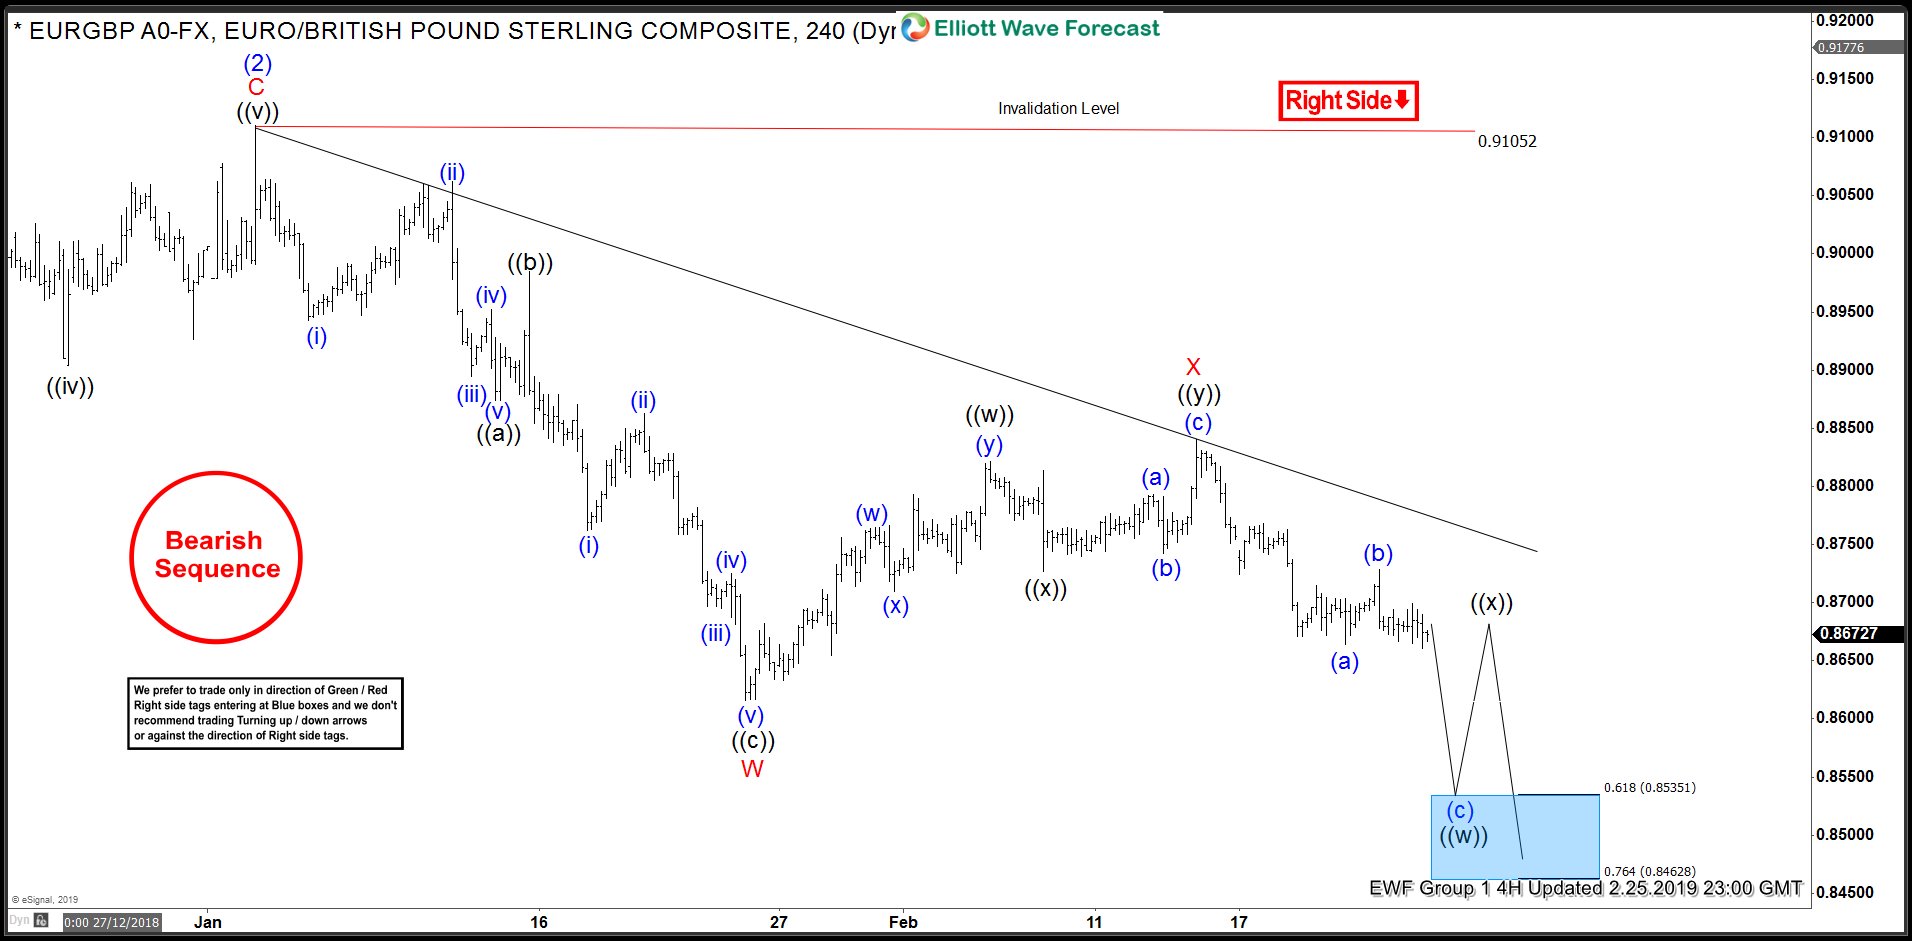
EURGBP shows a sequence of lower low from August 29, 2017 high, suggesting further downside is likely. The bounce to 0.9105 on January 3, 2019 high ended wave (2). From there, pair declines as a double three Elliott Wave structure where wave W ended at 0.8615 and wave X ended at 0.884. Pair still needs to break below wave W at 0.8615 to confirm that the next leg lower in wave Y has started. Until then, a double correction in wave X still can not be ruled out.
The internal of wave W unfolded as a zigzag Elliot Wave structure. Down from 0.9105, wave ((a)) of W ended at 0.8874, wave ((b)) of W ended at 0.8985 and wave ((c)) of W ended at 0.8615. The bounce in wave X unfolded as a double three structure in lesser degree where wave ((w)) ended at 0.8821, wave ((x)) ended at 0.8727, and wave ((y)) ended at 0.884. Wave Y is currently in progress as a double three structure. Near term, expect pair to extend lower towards 0.846 – 0.853 area to end wave ((w)) of Y, then it should bounce in wave ((x)) of Y before the decline resumes.
4 Hour EURGBP Elliott Wave Chart