The World Indices have seen the biggest decline since the lows at 2009. However, despite the size of the decline, it does not affect the overall trend. We at Elliott Wave Forecast always say that knowing the cycles and Market sequences are the key to become a successful trader. Many people believe the Market works in a straight line and of course that is not the case.
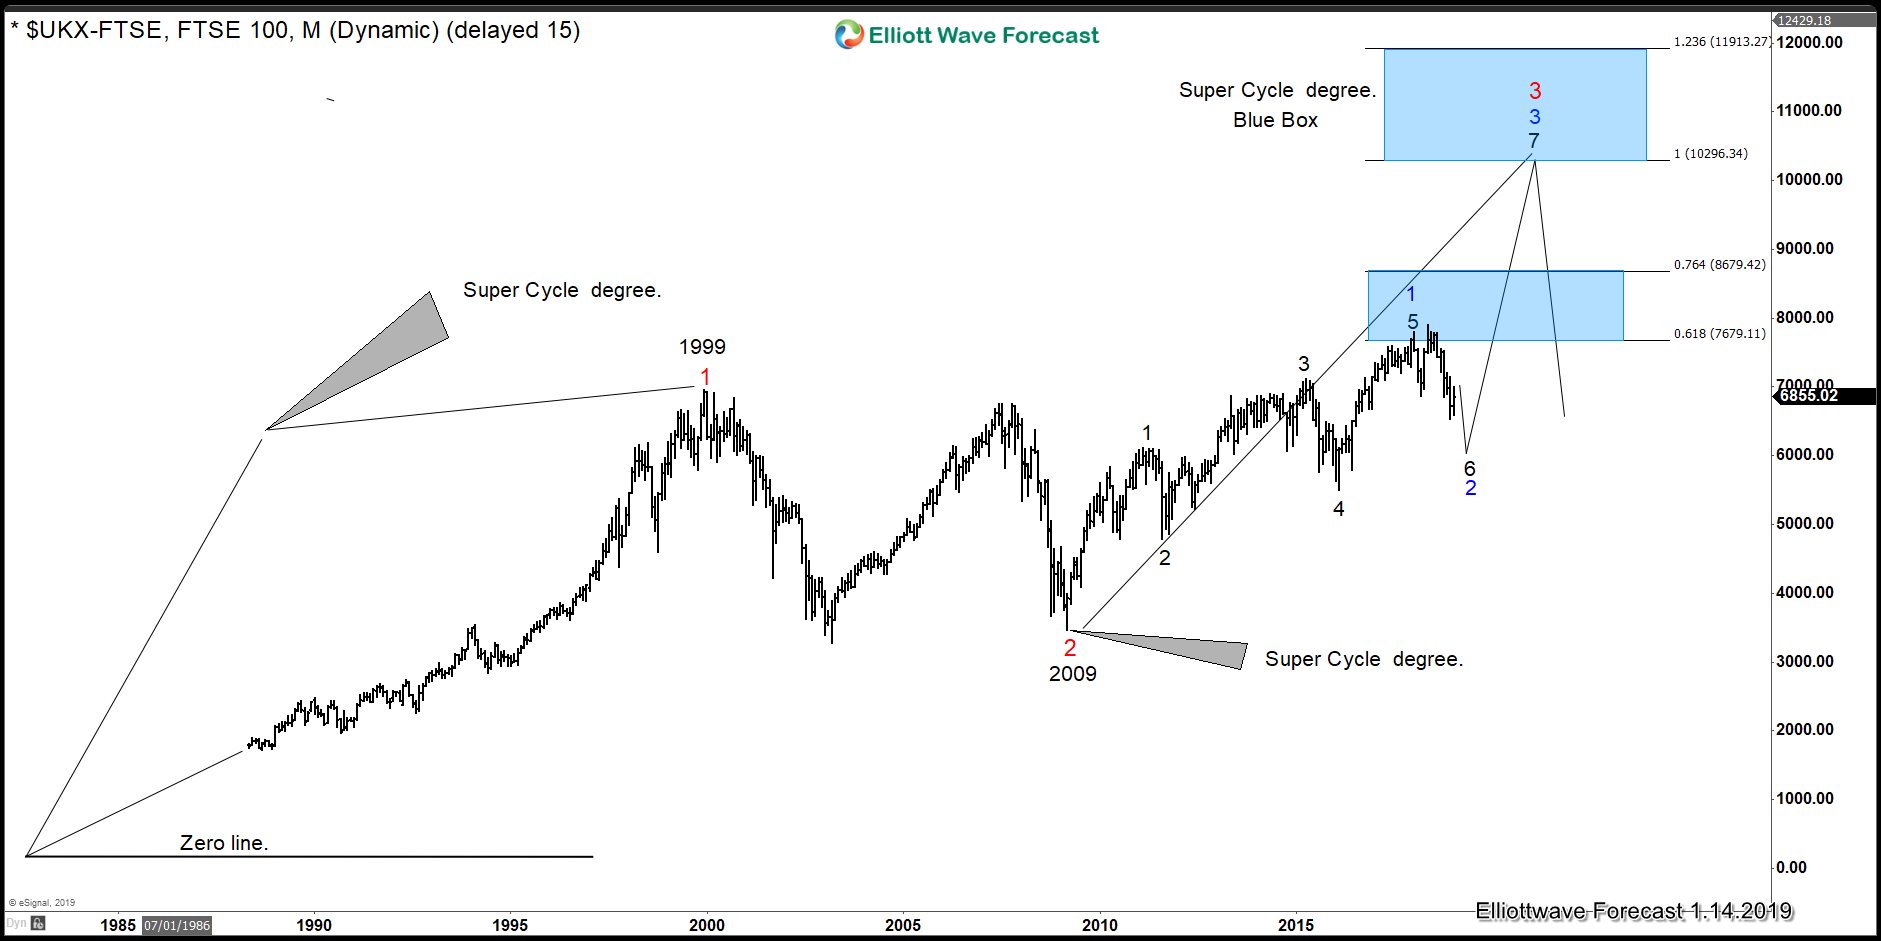
We track most of World Indices and over 100 instrument across the World. In addition to analyzing using Elliott Wave technique, we also correlate them to get the edge of the Market. The following chart shows FTSE ($UKX-FTSE) Elliott Wave Grand Super cycle since the all time low. We can see how we have not reached the 100% Blue Box at 10296.34 – 11913.27 which will be a moment when 2 Super cycle degree will reach equal length in price. The first super cycle degree goes from all-time low to 1999, whereas the other one started at 2009.
This suggests that until these two cycles reach 100%, we should keep buying the World Indices. We look at other instrument within the Indices group to discover the next entry levels and the best timing. The $UKX-FTSE chart is showing the Monthly path and it shows an incomplete sequence price wise in red. In addition, it also shows 5 swing incomplete sequence in black from 2009 low which is also a bullish event. The combination of both bullish sequences from two degrees suggest that the Index will likely remain above the 2009 low.
This also means that the Index will continue higher when swing 6 black or swing 2 Blue ends. As we are saying to members, this decline in World Indices is another chance to buy stocks and Indices at very good levels. As always, the social media’s bias of a big market crash will again become another trap. Nothing big will happen at minimum
until year 2020-2022 and it can even pass those times. Until then, keep buying the dips in World Indices in 3-7-11, The ruling trend is still higher.
FTSE Elliott Wave Sequence Monthly Chart