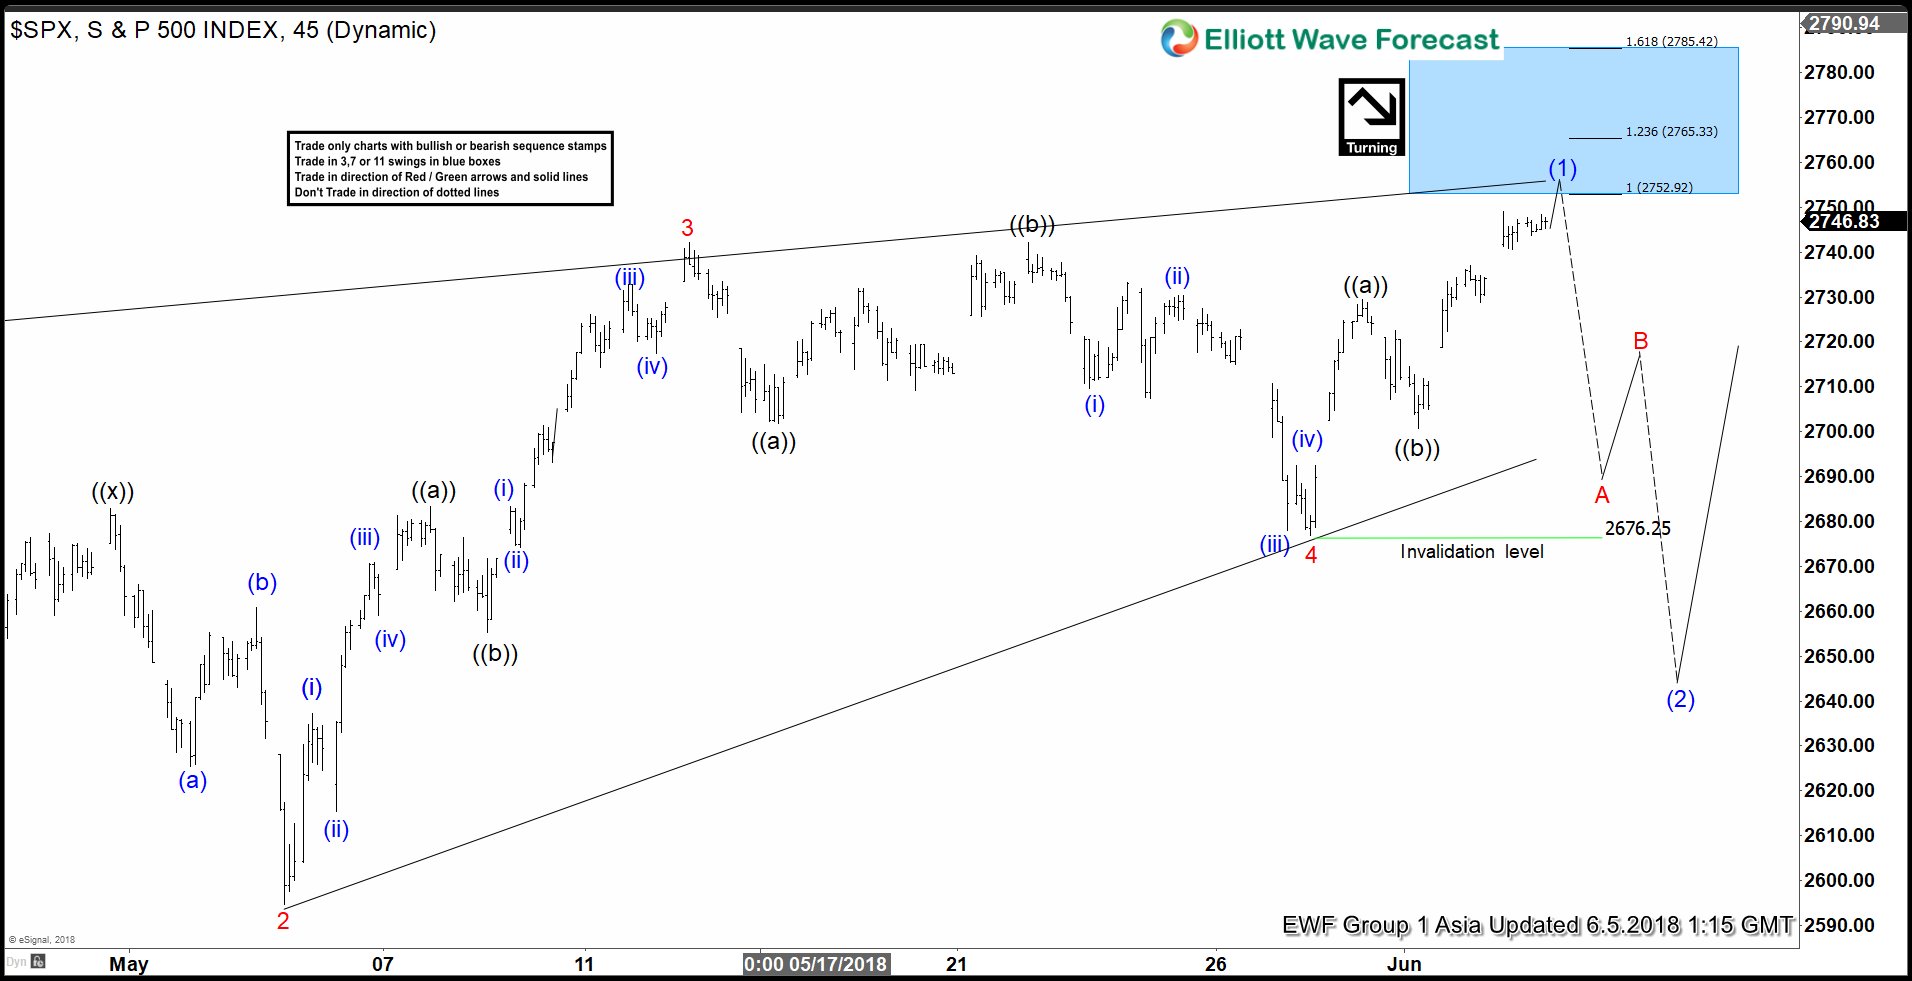
SPX short-term Elliott wave view suggests that the rally from 4/02/2018 low (2553.8) is extending higher in 5 waves structure. These 5 waves are expected to be part of a leading diagonal structure within intermediate wave (1) higher. The move higher from 2553.8 low has the characteristic of a diagonal where the internal distribution of each leg higher shows sub-division of 3 waves and there’s an overlap between Minor wave 1 & 4 .
The internals of a rally from 2553.8 low ended Minor wave 1 at 2717.49 in 3 waves corrective sequence. Down from there, the pullback to 2594.62 low ended Minor wave 2 as Elliott wave double three structure. Above from there, the rally to 2742.1 high ended Minor wave 3 as Elliott Wave Zigzag structure. Below from there, the pullback to 2676.81 low ended Minor wave 4 as zigzag structure. Near-term focus remains towards 2752.9 – 2765.33, which is 100%-123.6% Fibonacci extension area of Minute wave ((a))-((b)) to end Minor wave 5. The move higher should also complete the cycle from 4/02/2018 low (2553.8) within Intermediate wave (1). Afterwards, the index is expected to do a pullback in Intermediate wave (2) and expected to find buyers in 3, 7 or 11 swings for further upside. We don’t like selling the index.
SPX 1 Hour Elliott Wave Chart
Source : https://elliottwave-forecast.com/stock-market/spx-elliott-wave-analysis-close-pullback/


