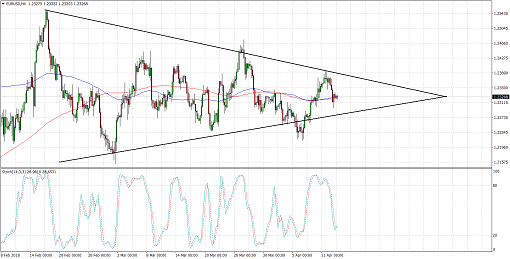
EURUSD has formed lower highs and higher lows to create a symmetrical triangle on its 4-hour time frame. Price is approaching the peak of the formation so a breakout could be due soon. Note that the chart pattern spans 1.2150 to 1.2550 so the resulting breakout could lead to either a 400-pip rally or a 400-pip drop.
The moving averages have been oscillating so it’s tough to tell which direction it could take at this point. Stochastic is on the move down, though, which suggests that sellers have the upper hand.
Dollar demand has ticked higher in recent sessions thanks to higher US bond yields. Easing geopolitical risks from Syria and China have also contributed to improved investor sentiment, but there has been talk of a potential US military strike on eight areas in Syria.
US preliminary UoM consumer sentiment and inflation expectations are lined up today and these could allow the Greenback to extend its climb if the numbers turn out stronger than expected. As for the euro, German final CPI and the regoin’s trade balance are up for release.
By Kate Curtis from Trader’s Way