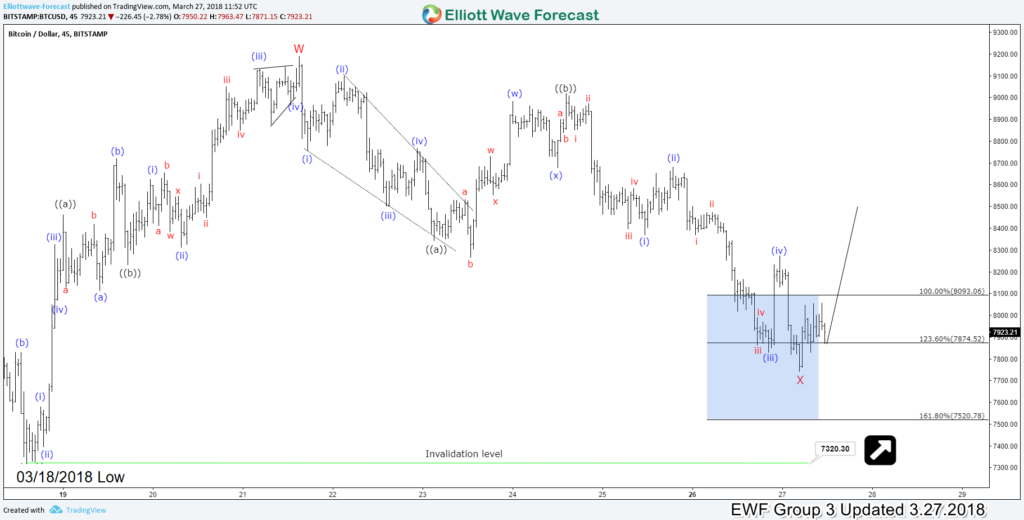
Bitcoin Elliott Wave Analysis in the short term is showing an interesting corrective structure suggesting a recover to take place after it finishes the current move.
The digital instrument is correcting the cycle from 03/18 low in 3 waves as a Zigzag structure which reached the 100% – 161.8% Fibonacci extension area $8093 – $7520 from where it’s expected to resume a new cycle to the upside or at least bounce in 3 waves as long as it remain above $7320 low.
Bitcoin Elliott Wave 1H Chart 03.27.2018
If Bitcoin manage to break above 03/23 peak then it will continue the bounce higher toward $9550 – $10080 area correcting the cycle from 02/20 peak before another pullback can be seen. In case the short term bounce fail and BTC breaks below $7320 low, then it will open an extension lower toward $6600 – $6000 area.
Bitcoin Elliott Wave views can be used for trading purpose if certain conditions are met which we do provide for our clients. Moreover, the blue box areas in our charts are a high frequency areas where the Markets are likely to end cycles and make a turn. Consequently, BTC most likely will react from current levels.
Source : https://elliottwave-forecast.com/forex/bitcoin-elliott-wave-analysis/

